Hey there, I’m
Taylor Simpson
I lead product design with curiosity, a systems mindset, and an eye for detail.
I’m a Michigander living in Seattle. I have 6+ years of experience designing for data-driven enterprise products at Pinterest, Custora, and early-stage startups. My visual design background is with the MarCom team at Apple and Isometric Studio. I have a Graphic Design BFA from the Maryland Institute College of Art.
tsimpson217@gmail.com
LinkedIn
tsimpson217@gmail.com
︎ This portfolio does not have my most recent work on the Measurement design team at Pinterest because I haven’t been actively looking for new roles. In my 3+ years at Pinterest I feel my product, design, and research sense has come a long way, along with my ability to lead across multiple teams.
Overview of Selected Projects
2017-2019
2017-2019

Command Center
Research and design for goal-setting functionality unavailable elswhere in the MarTech industry.
Design System & Documentation
Refining the Custora design language to increase production speed and putting processes in place to maintain a design code of ethics.

Overview Dashboard
User research and sketching to test hypotheses on creating a more useful Custora overview dashboard.
Project 1
Lead Product Designer
Team of one Product Manager and eight Engineers
2017-2019
Command Center
Lead Product Designer
Team of one Product Manager and eight Engineers
2017-2019
Custora’s largest release to date, and the culmination of a changing business mindset, multiple MVP versions, user research, and beta tests over a year and half.
Problem
- Although retailers have revenue goals to make, they often rely on intuition instead of hard numbers to track their progress
- If retailers do have numbers, understanding the root cause of why the numbers are up or down is another mountain
- Not all Success members were using the same methods to aid retailers
- Custora was not selling as well as it used to, our conversions and contract amounts were dropping
Outcomes
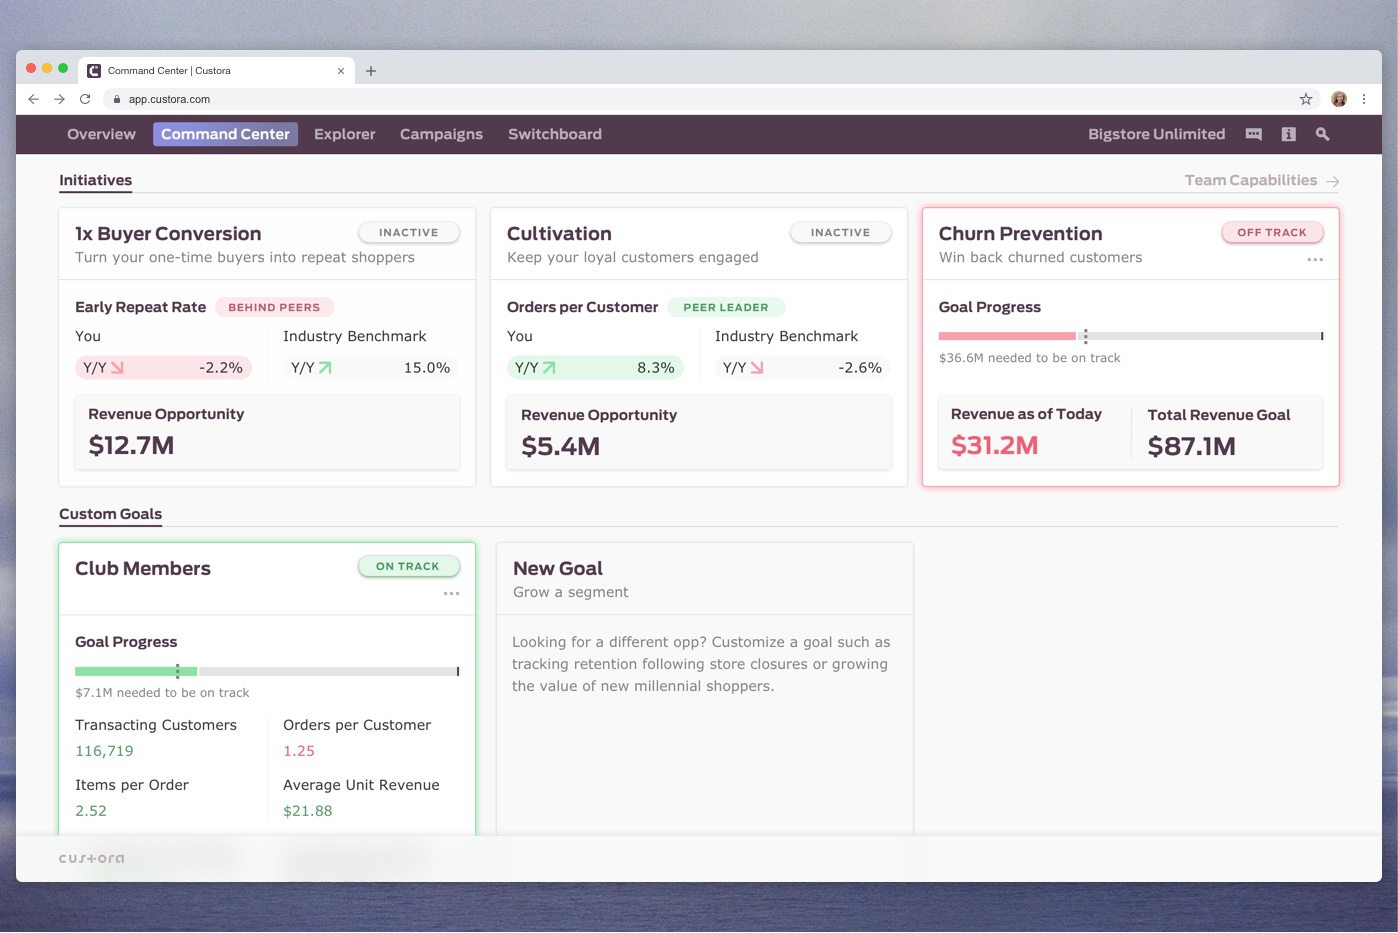
- Eight-part product allowing retailers to identify, tackle, and track business objectives such as 1x Buyer Conversion, Cultivation, and Churn Prevention, or to create a custom goal based around any customer segment
- Product unavailable elsewhere in the MarTech industry
- Unified sales processes, increasing new business
- Saved multiple Custora relationships with retailers, and strengthened others
- Retailers using Command Center showed increased active usage of other parts of Custora
- More retailers moved to the ‘Green Adoption Zone,’ meaning they had high Custora engagement in both insights and activation–our key measures of business retention
- New exec-level engagement from retailers, key to forming successful B2B relationships and to the retailer’s success
Product Evolution and Process
The Idea
A year and a half prior to the Command Center release, a group created an MVP called Discovery Zone as their Custorathon (Custora’s bi-annual hackathon) project. Discovery Zone surfaced insights such as distribution and revenue of key segments. The code was only run locally, but it was a good test as to what insights we were capable of pulling and what value they brought.
v1 - Spotlight
A few months later Discovery Zone made it into the product cycle. Our customers were asking deep questions that we couldn’t yet answer, namely around identifying marketing opportunities for improvement. Surfacing insights on Future Value Tiers, Price and Promotion, Personas, and Lifecycle Status was a critical first step to the evolution of Command Center. At this time, we renamed the project Spotlight, pointing to the function of highlighting the most valuable segments to target. Due to unforeseen data issues, we decided to keep the MVP admin-only. We could then gauge how Customer Success was using the MVP and adjust track based on the technical issues.


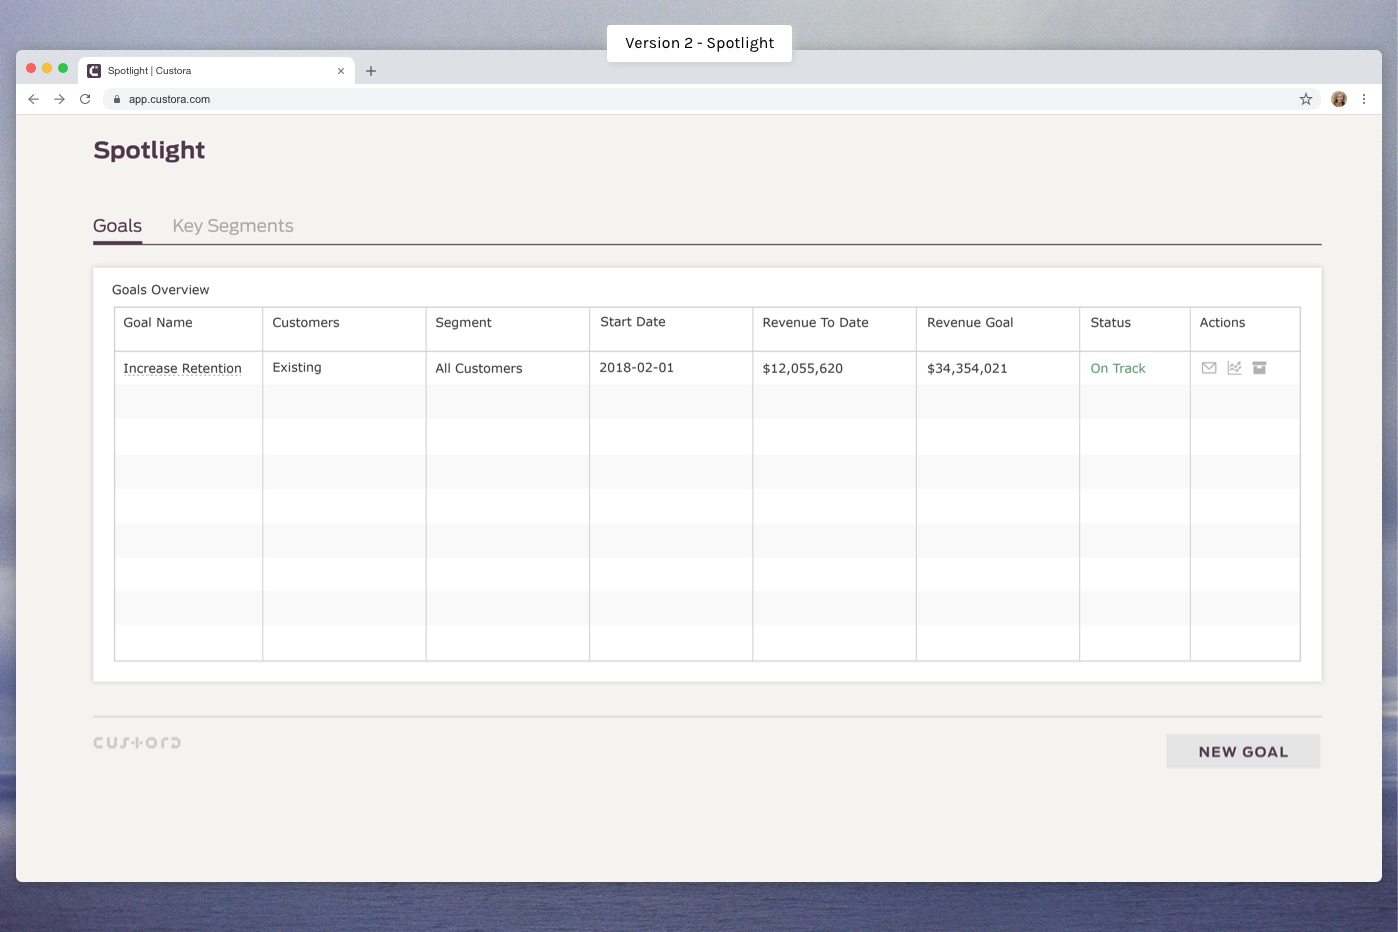
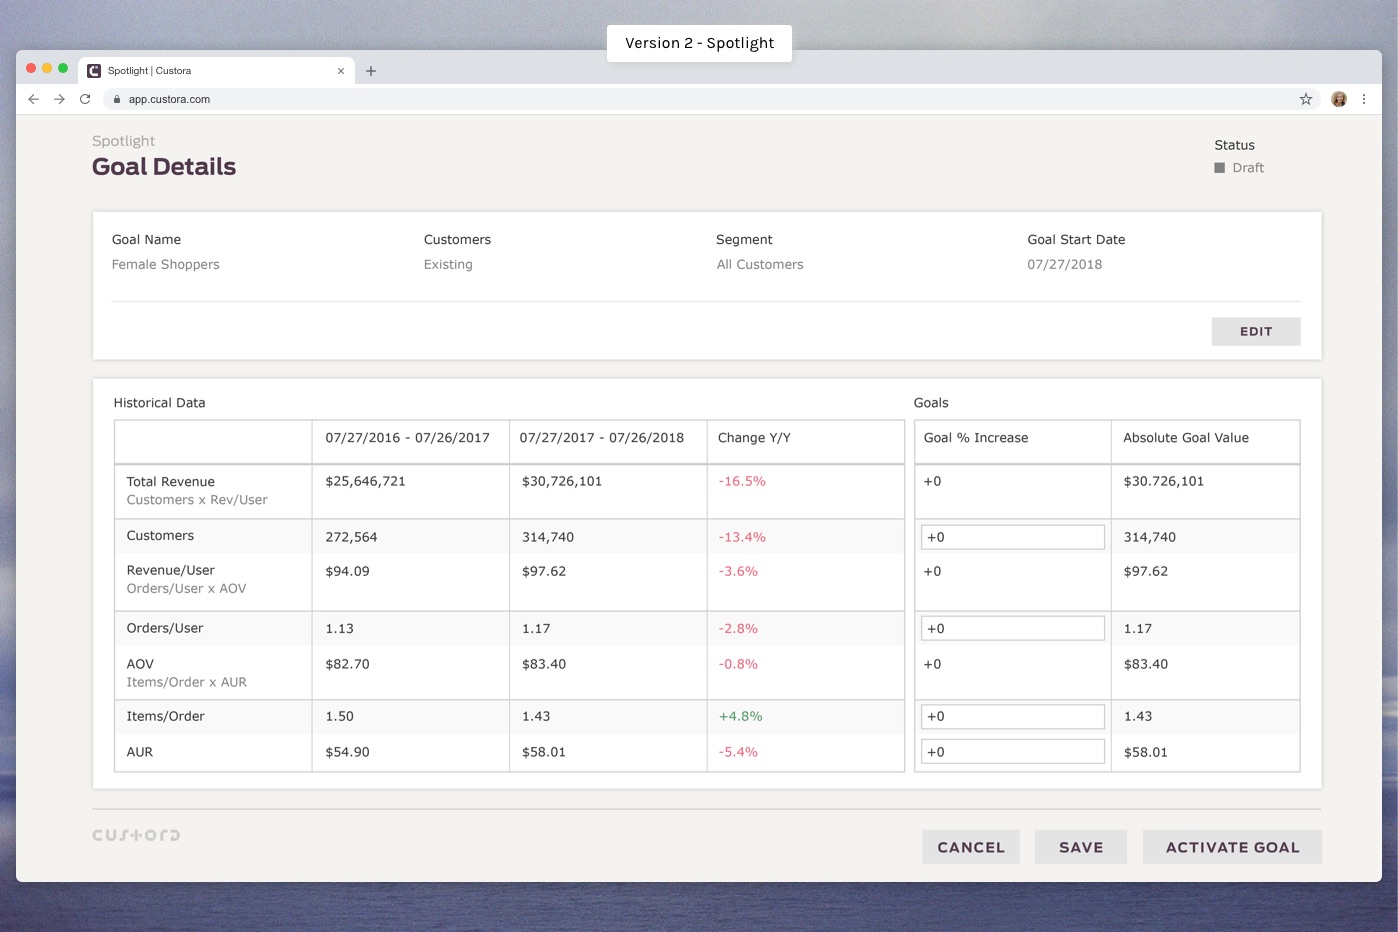
v2 - Spotlight
Following many hours of user interviews to gain a better understanding of the kinds of goals at the top of retailers’ minds, we focused on the capability to track any segment across any time frame. It was a lightweight way to test our hypotheses about what retailers would track and gain a better understanding of how they implemented and achieved goals within the org. We also developed a framework for creating hard numbers around goal metrics, a way to see how specific metrics contributed to overall revenue. With a few customers we ran beta programs and worked closely with them on their top business goals.
Following many hours of user interviews to gain a better understanding of the kinds of goals at the top of retailers’ minds, we focused on the capability to track any segment across any time frame. It was a lightweight way to test our hypotheses about what retailers would track and gain a better understanding of how they implemented and achieved goals within the org. We also developed a framework for creating hard numbers around goal metrics, a way to see how specific metrics contributed to overall revenue. With a few customers we ran beta programs and worked closely with them on their top business goals.
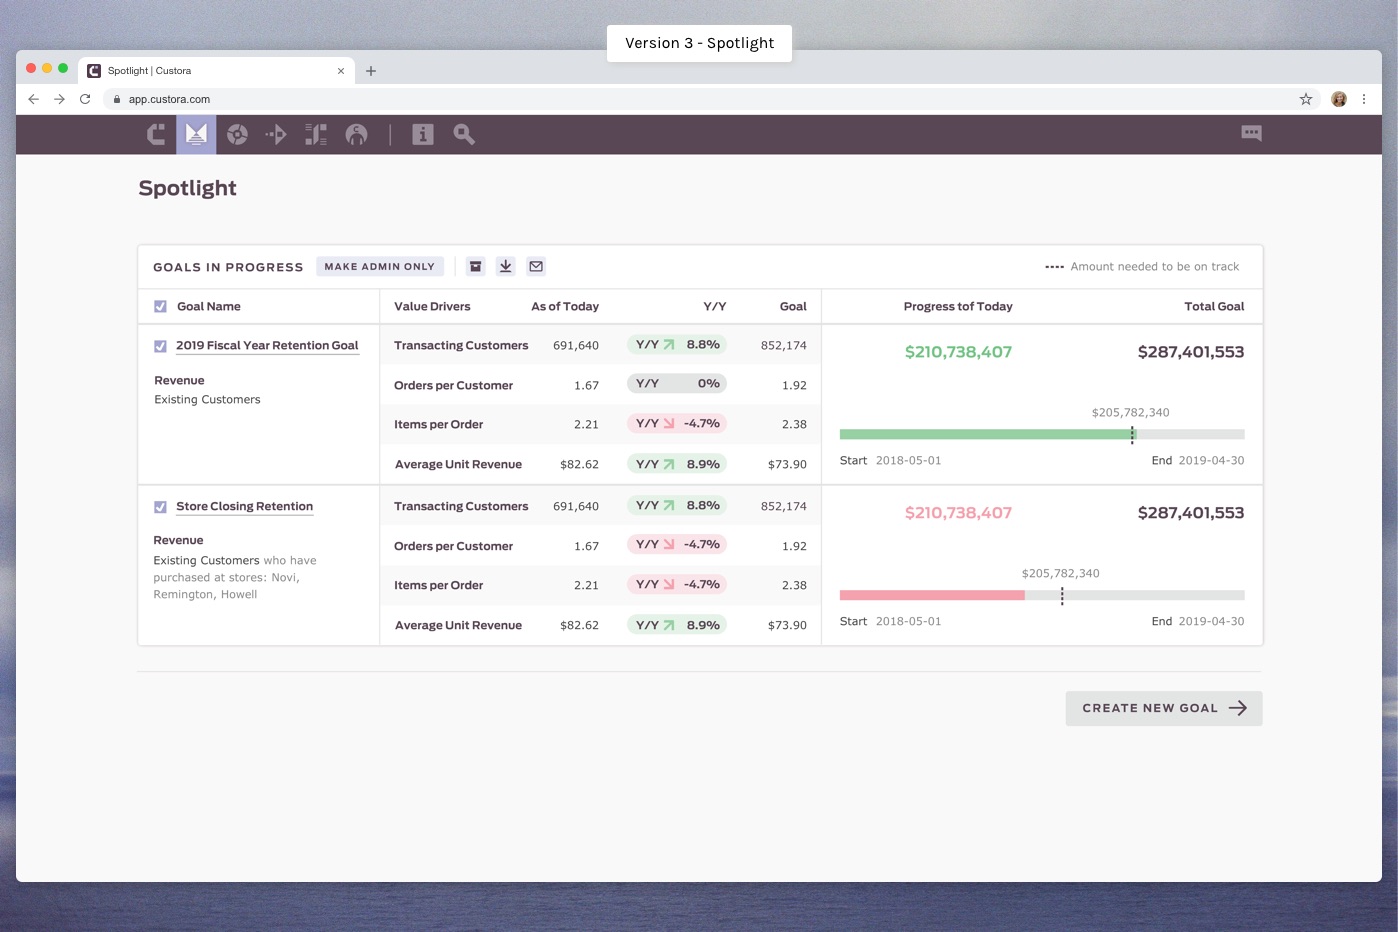
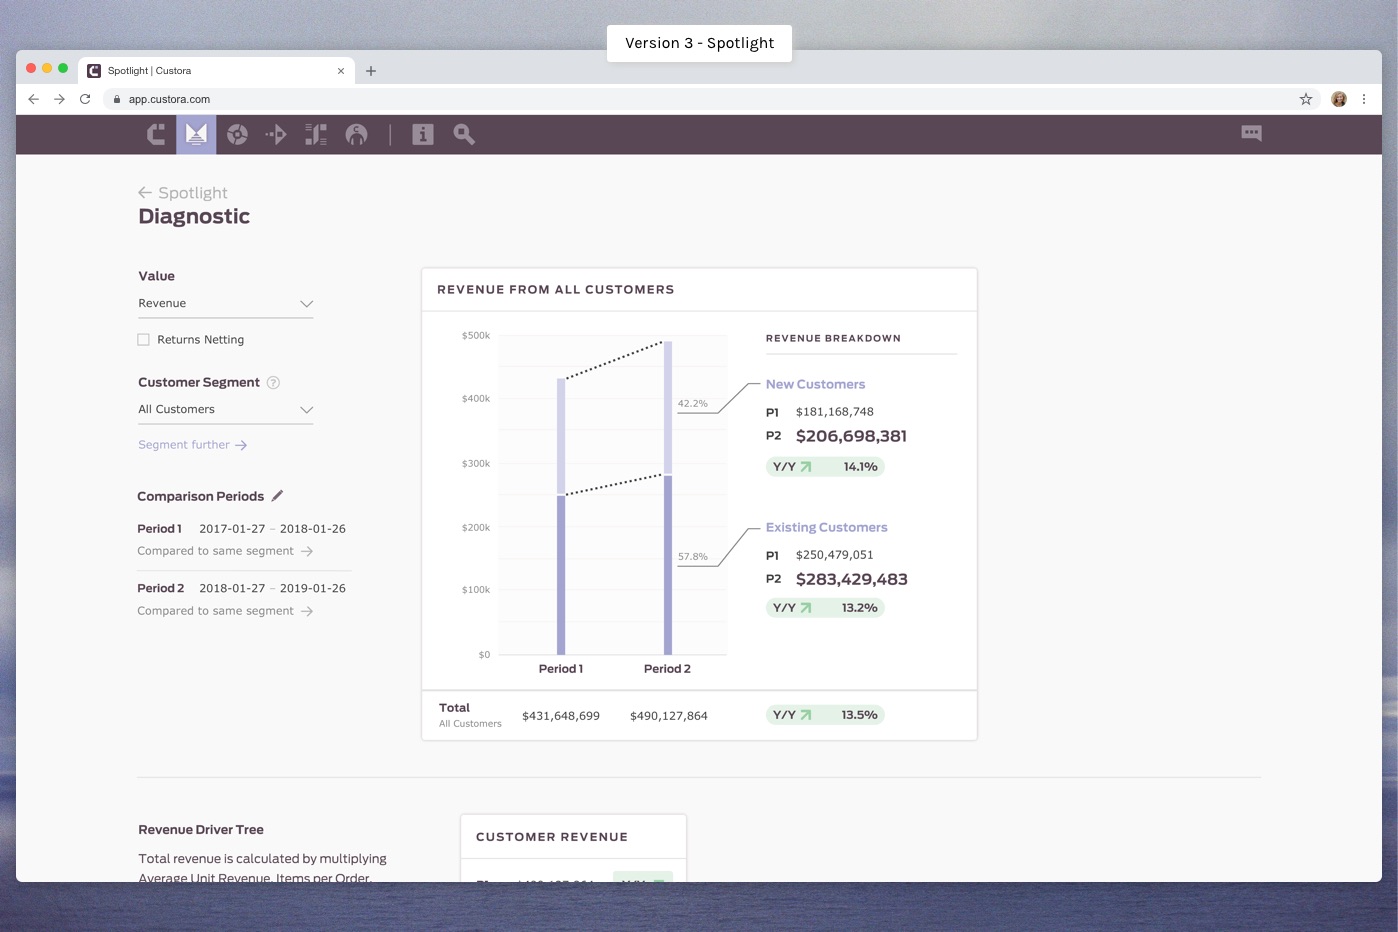
v3 - Spotlight
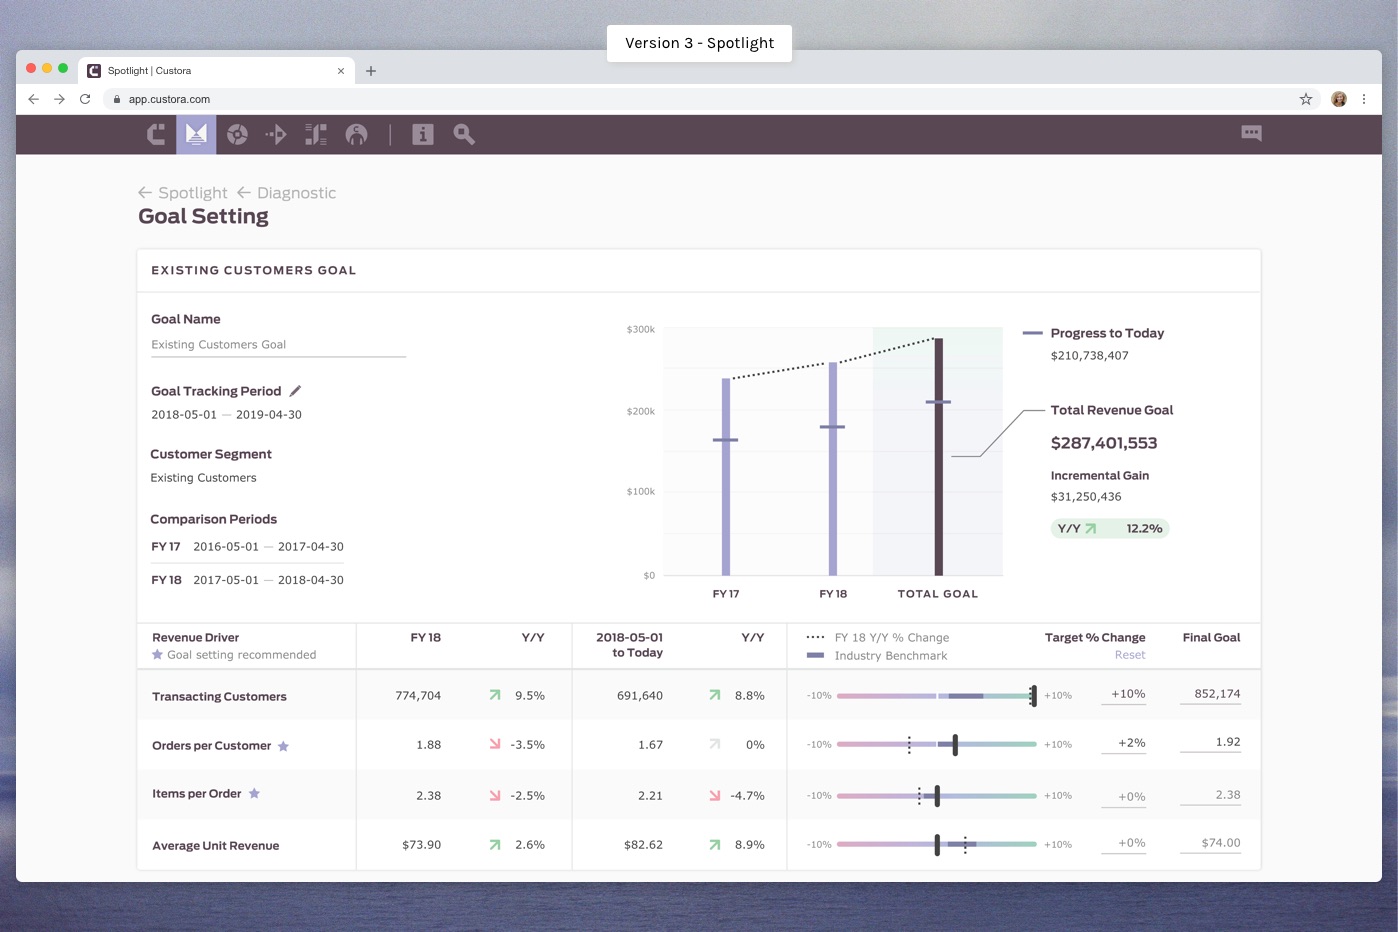
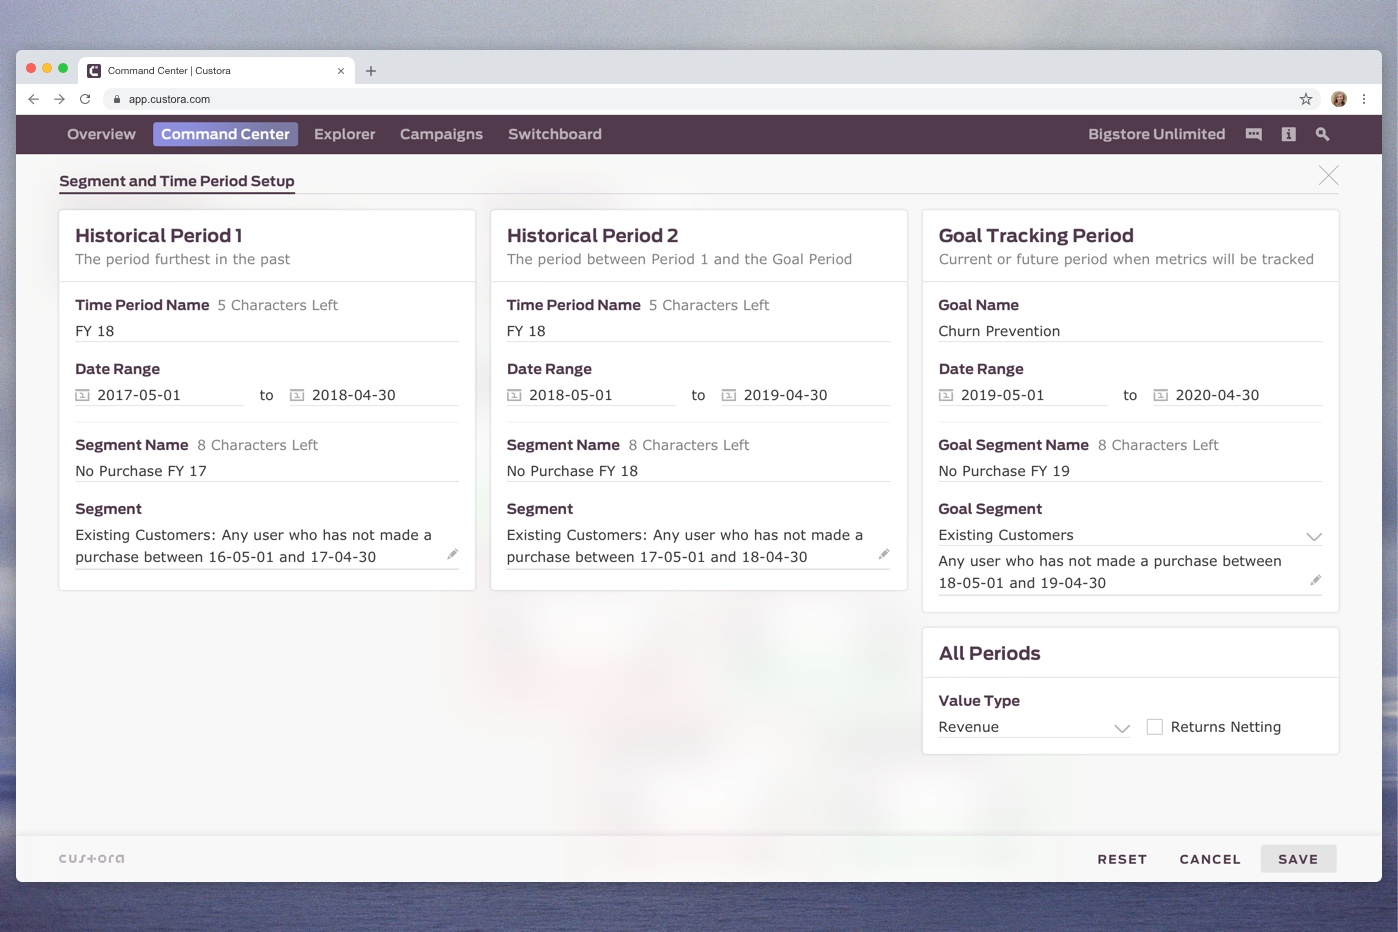
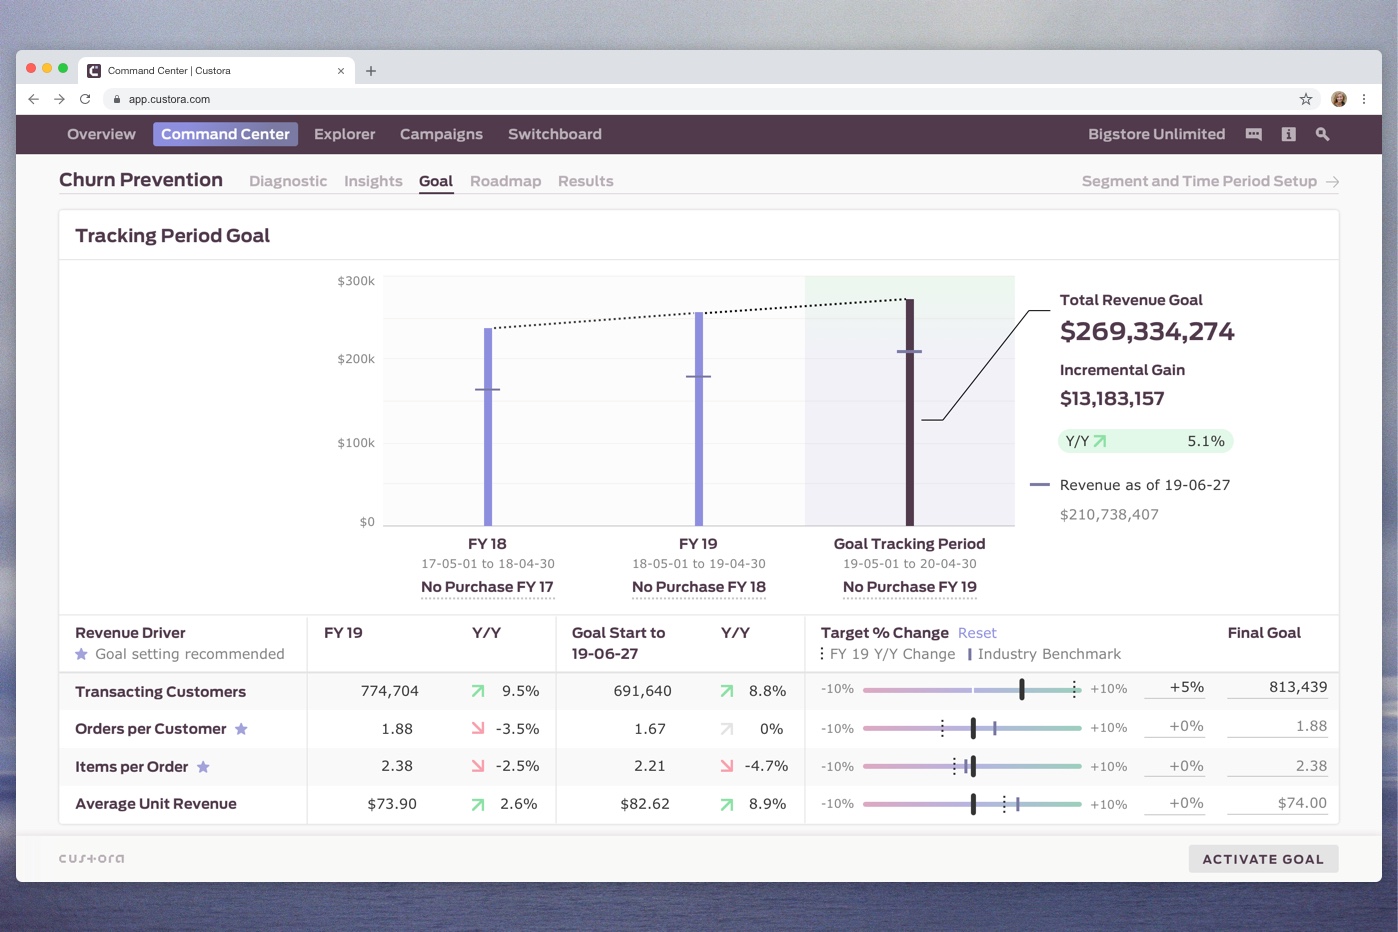
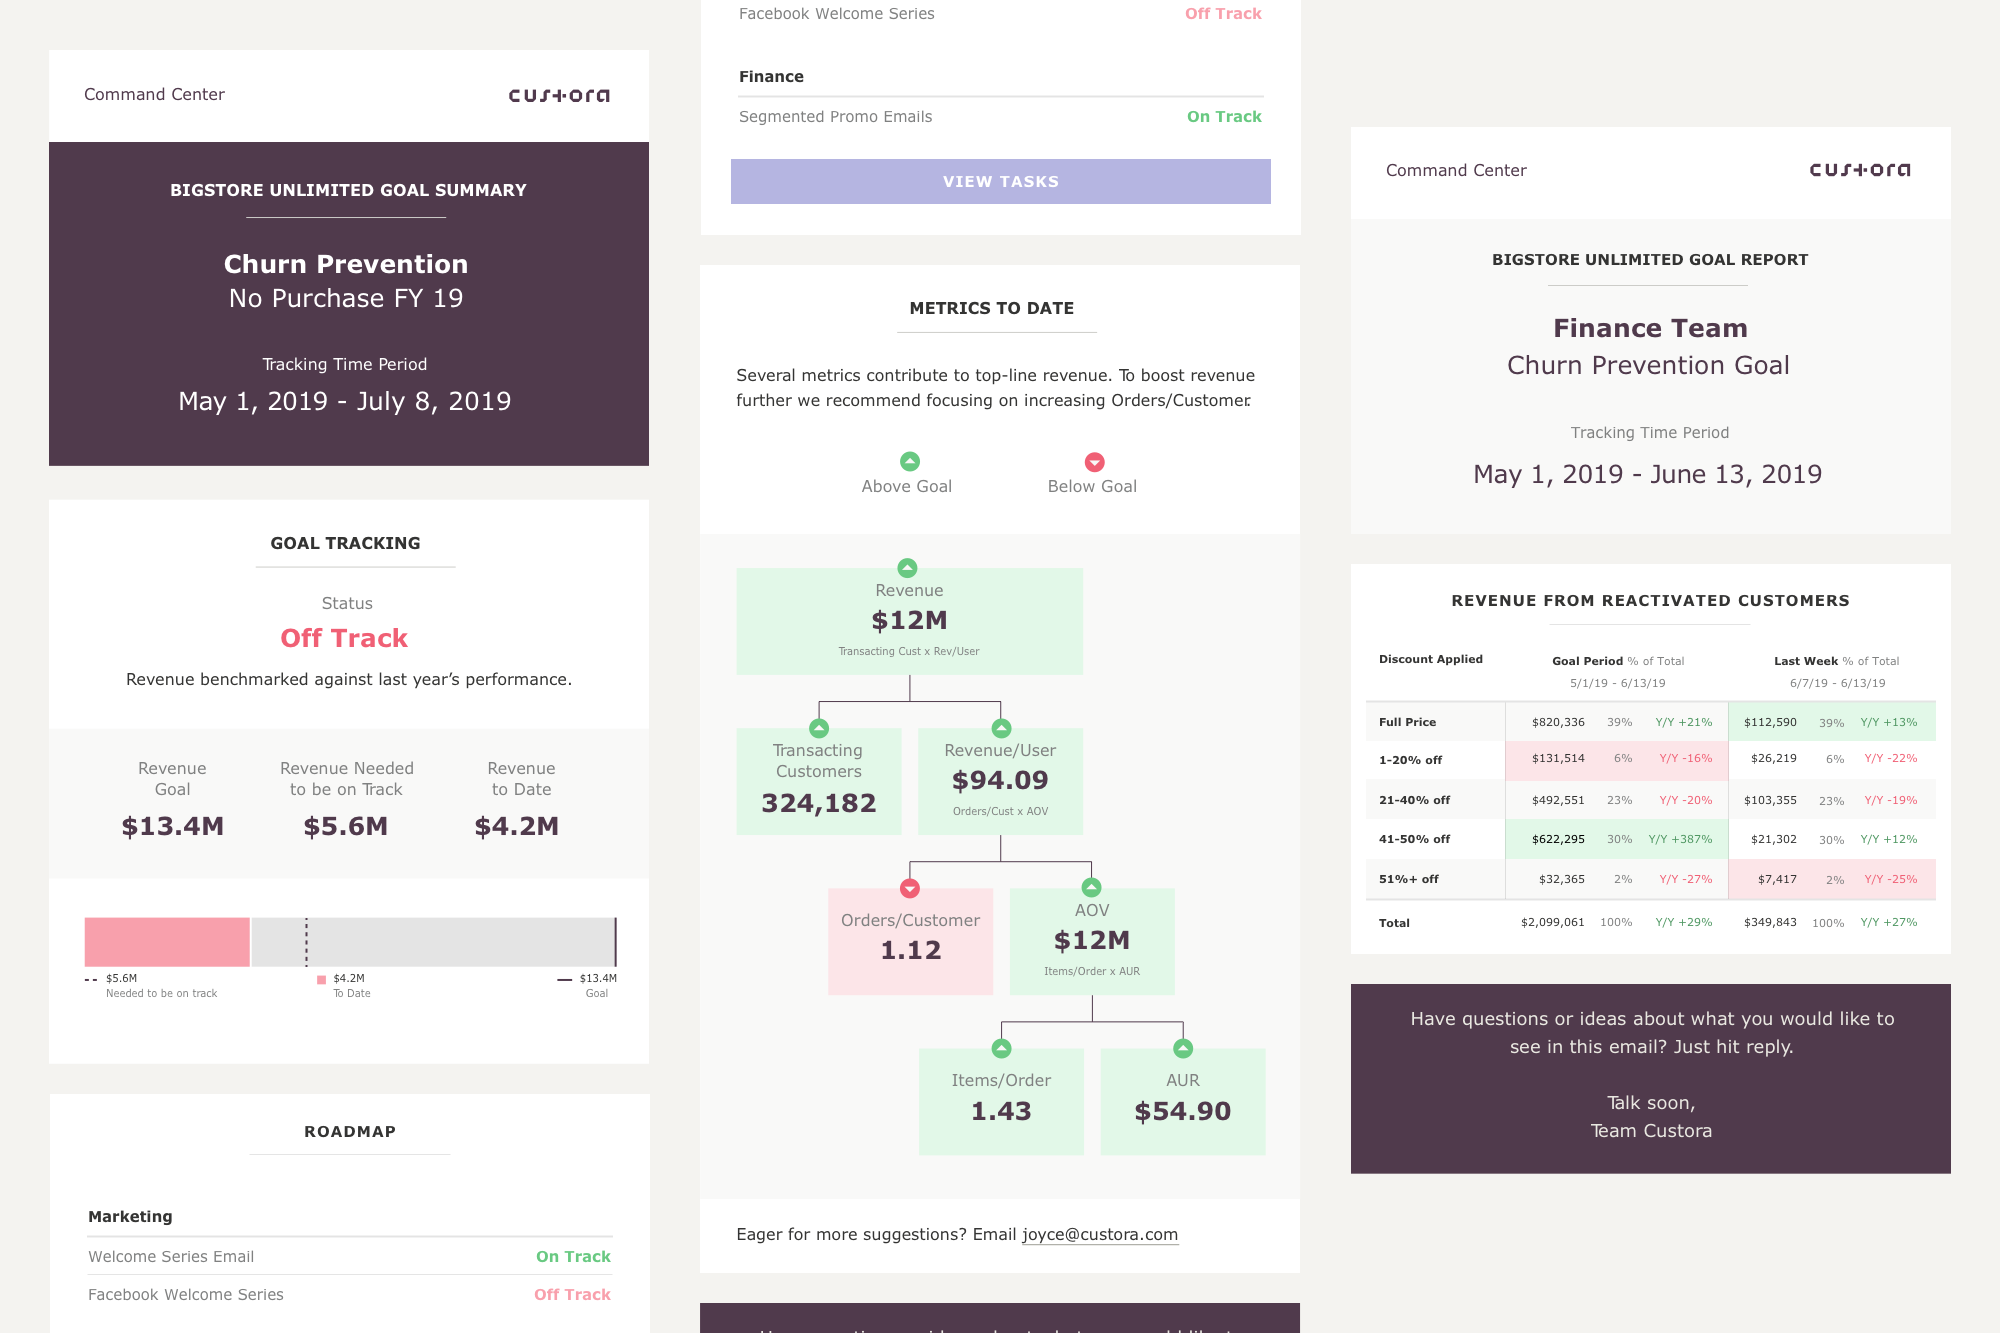
We got to a point where we felt we could begin to productize our learnings. We added additional functionality around segment and time period selection, value types, and returns netting, allowing retailers to get really specific with tracking. It was a big finding in the user research that retailers needed to get that granular with it. We also found that our revenue framework was proving to be a useful way to track results, but we needed to use the design to make it intuitive. With the diagnostic and goal setting, we used the revenue tree and goal sliders and graphs to put a visual to the numbers. The last part we added was an executive level weekly tracking email on the goal, helping to keep everyone in the org aligned on progress and future tactics.
We got to a point where we felt we could begin to productize our learnings. We added additional functionality around segment and time period selection, value types, and returns netting, allowing retailers to get really specific with tracking. It was a big finding in the user research that retailers needed to get that granular with it. We also found that our revenue framework was proving to be a useful way to track results, but we needed to use the design to make it intuitive. With the diagnostic and goal setting, we used the revenue tree and goal sliders and graphs to put a visual to the numbers. The last part we added was an executive level weekly tracking email on the goal, helping to keep everyone in the org aligned on progress and future tactics.
Command Center
When working on the next part, a way to track sub-segments, we began to question our objectives in a wireframe review with product and tech. At this point we halted work and took a few steps back. Through brainstorming sessions with company stakeholders and the greater product team, we tried to get to the root of what we were solving.
We discovered there was something much bigger going on, with many facets to consider.
- Customer Success felt uncomfortable having conversations with retailers around the current product–it was too open-ended.
- Not all Success members were using the same methods to aid retailers.
- Custora was not selling as well as it used to, our conversions and contract amounts were dropping.
We realized we needed to organize around the Custora methodology. This meant focusing on lifecycle insights and going after the most common goals we were apt to address: acquiring customers, increasing loyalty, and preventing churn. We decided to have those three goals ‘pre-built’ into the software, allowing Success to easily assess the opportunities and hit the ground running. We also needed to address the point after the goal is set, when strategies are devised and iterated upon. We identified three areas where this is crucial: understanding org constraints, gathering the insights to inform strategy, and carrying out the plan
Final Product Components
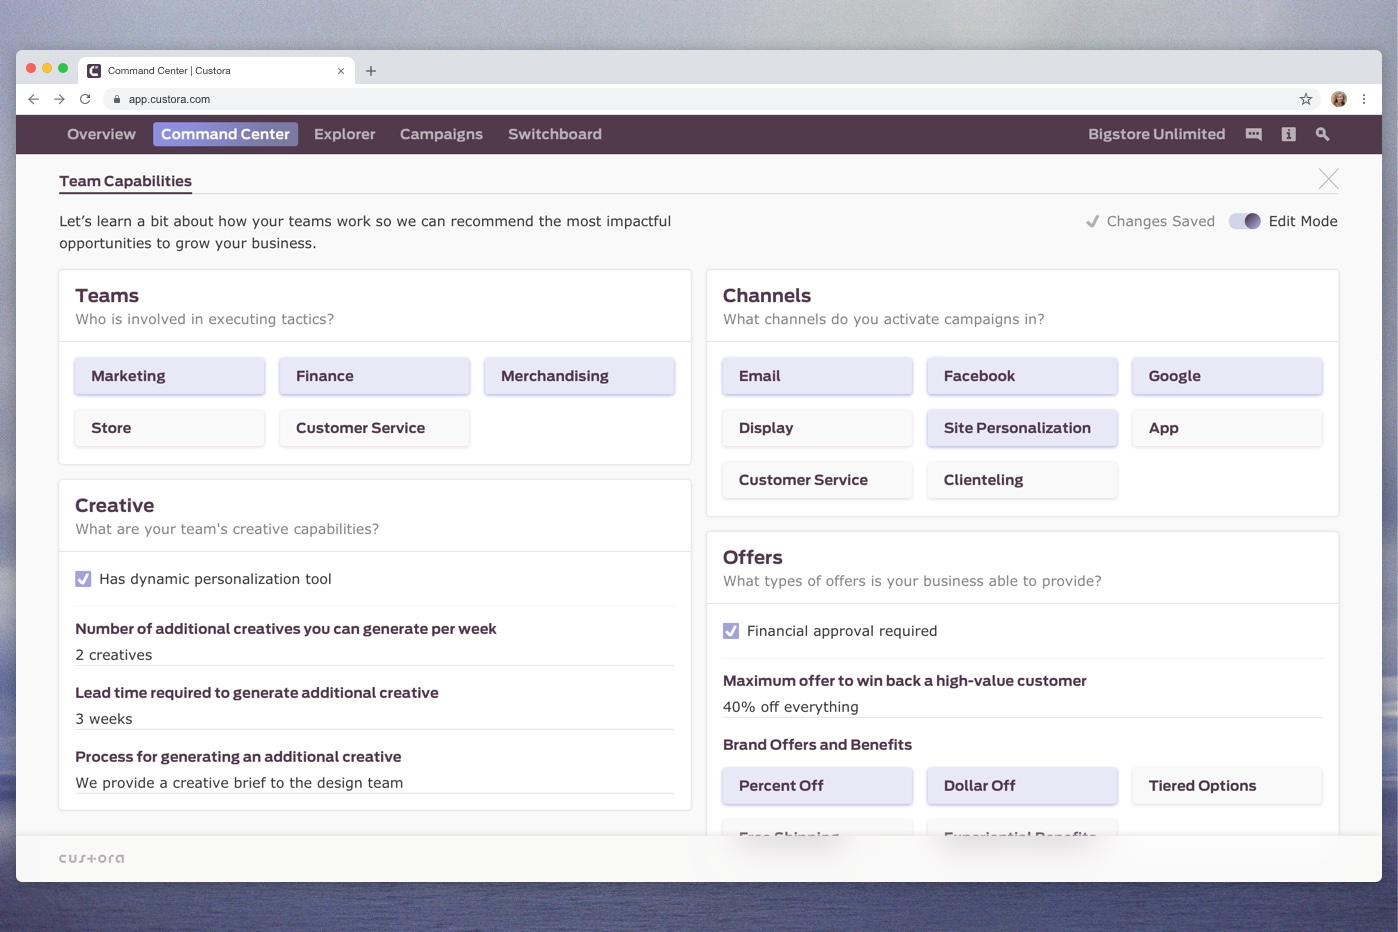
- Team Capabilities: Document the company's structure, available resources, and processes to recommend marketing opportunities that are aligned with the strengths of the organization, anticipate blockers for opportunities that might be high value but high effort, and develop launch plans to get ahead of those blockers.
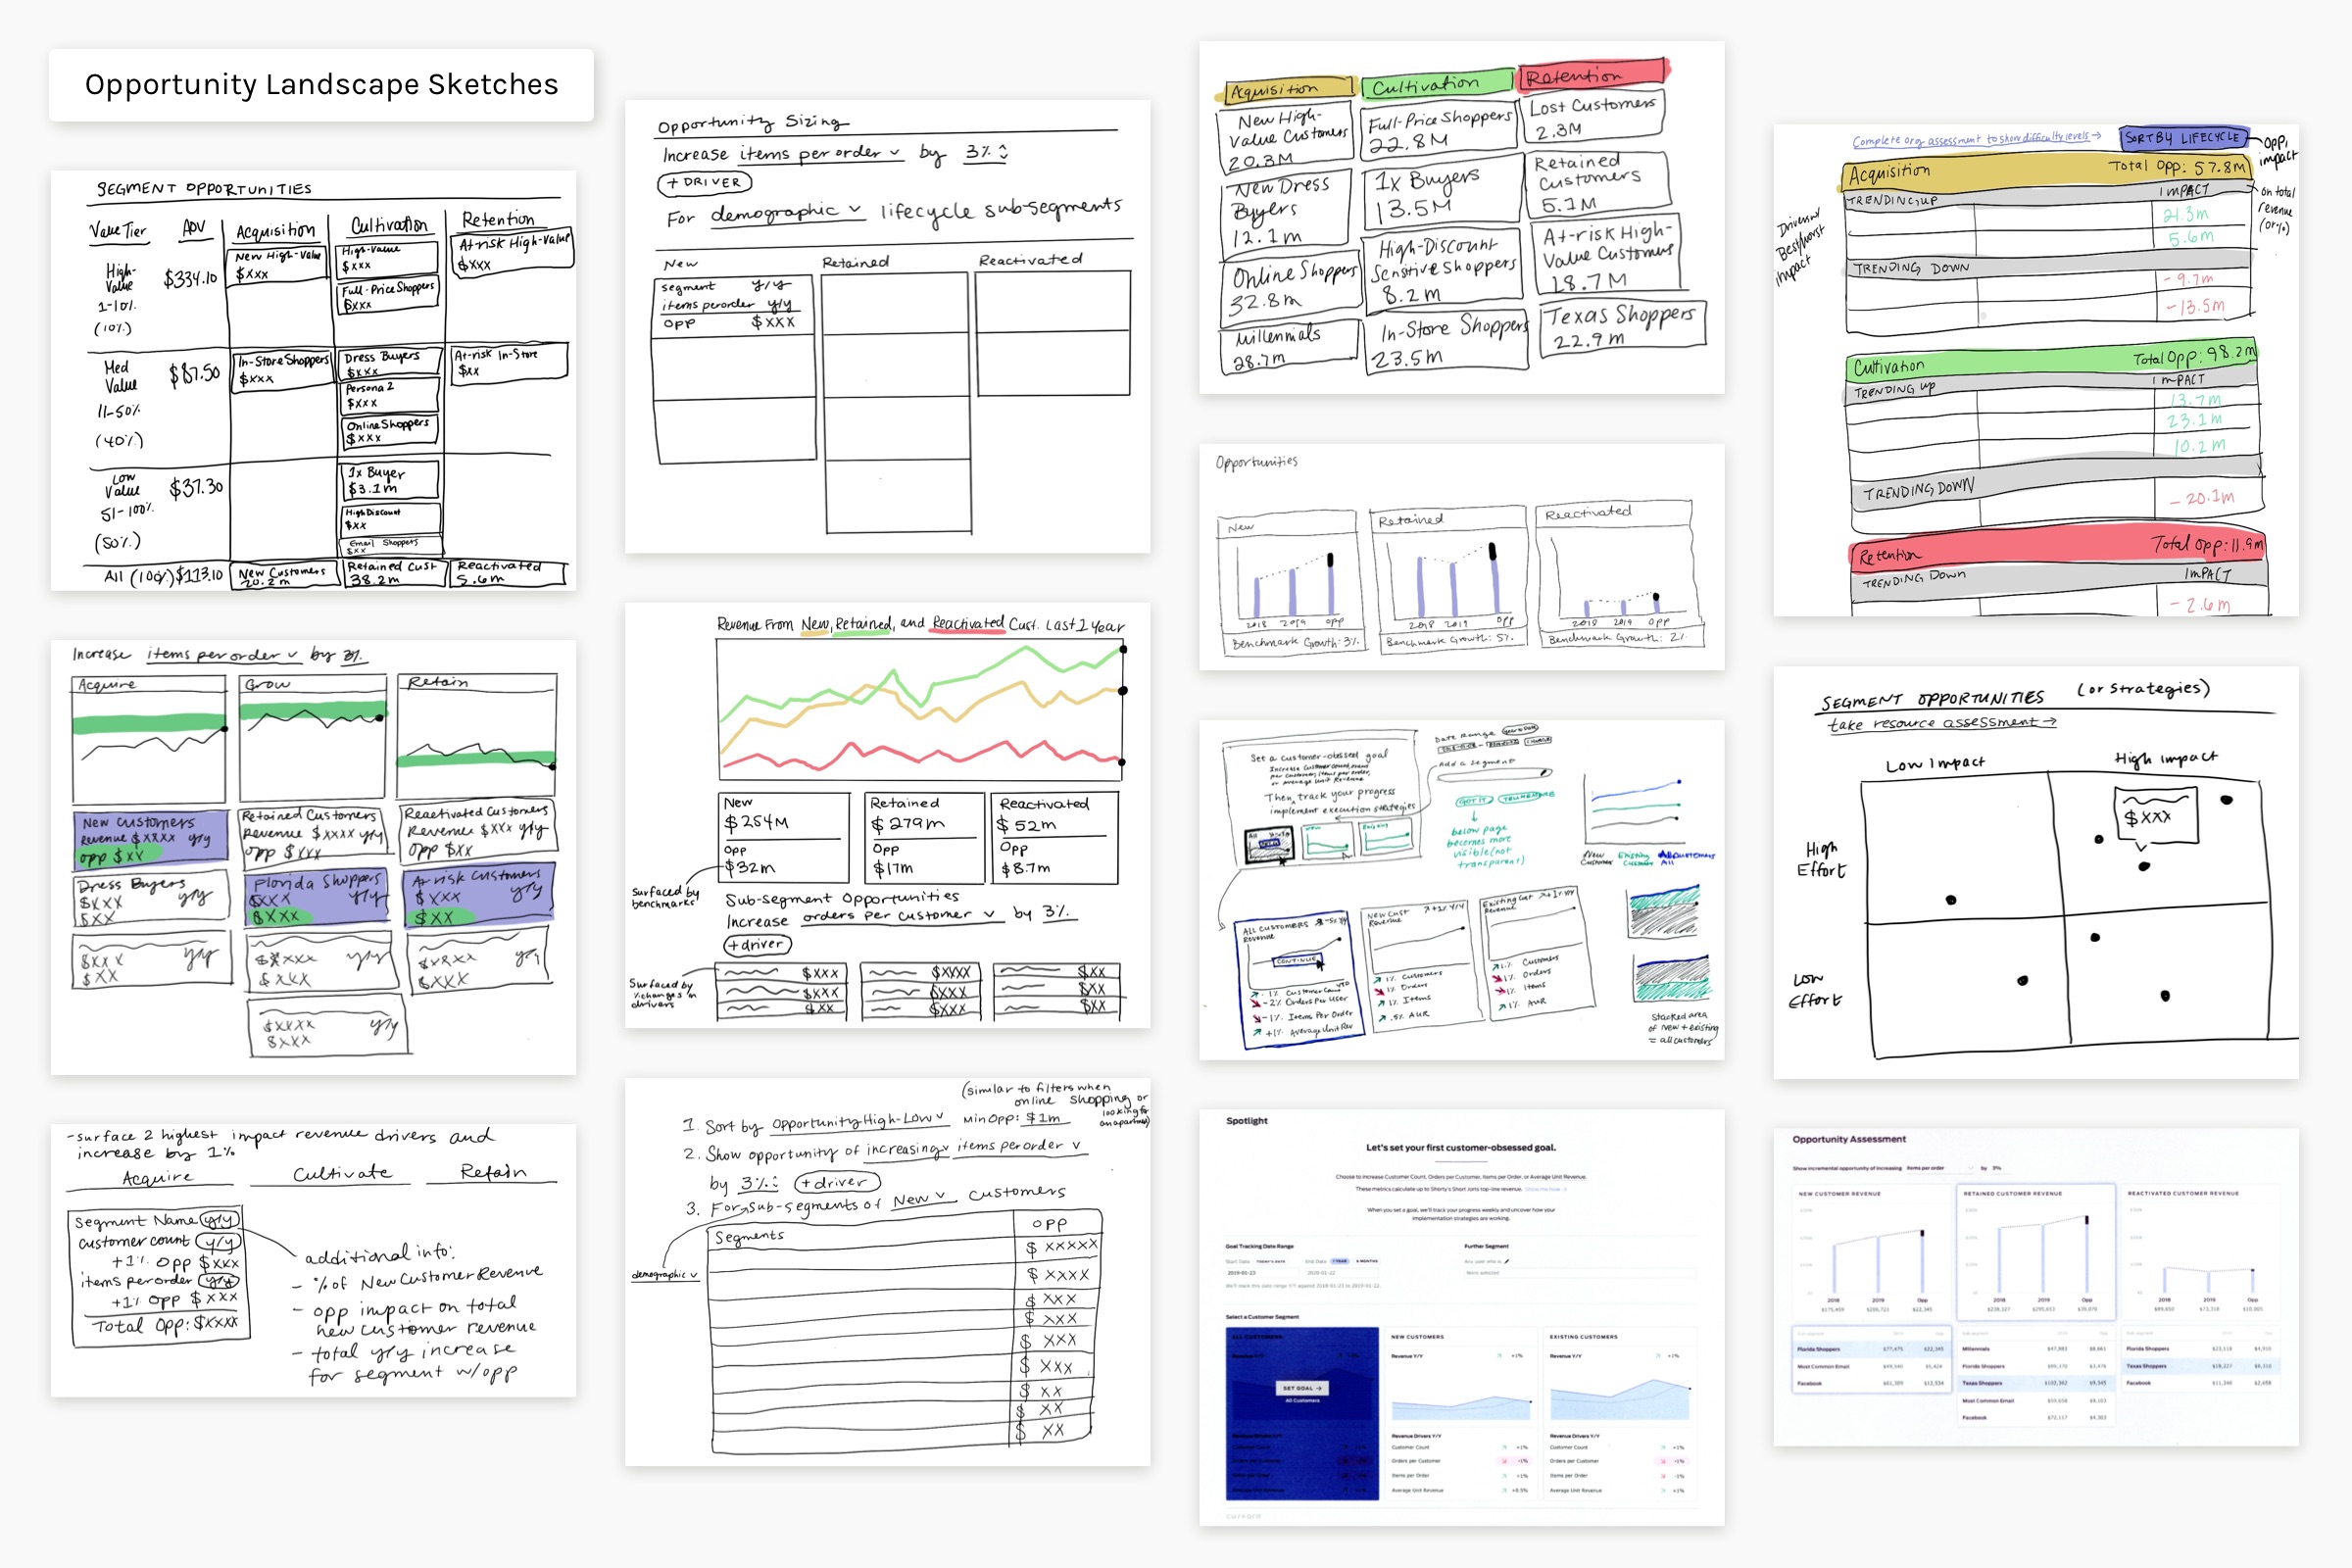
- Opportunity Landscape: Enables retailers and Customer Success to prioritize which solutions to focus on by providing opportunity sizing, calculated based off peer growth benchmarks.
- Setup: Customize segments and their related time periods. Name values for easy reference when goal is tracked. For example, if the periods are dated by the org’s fiscal year, adjust the date range and name it accordingly.
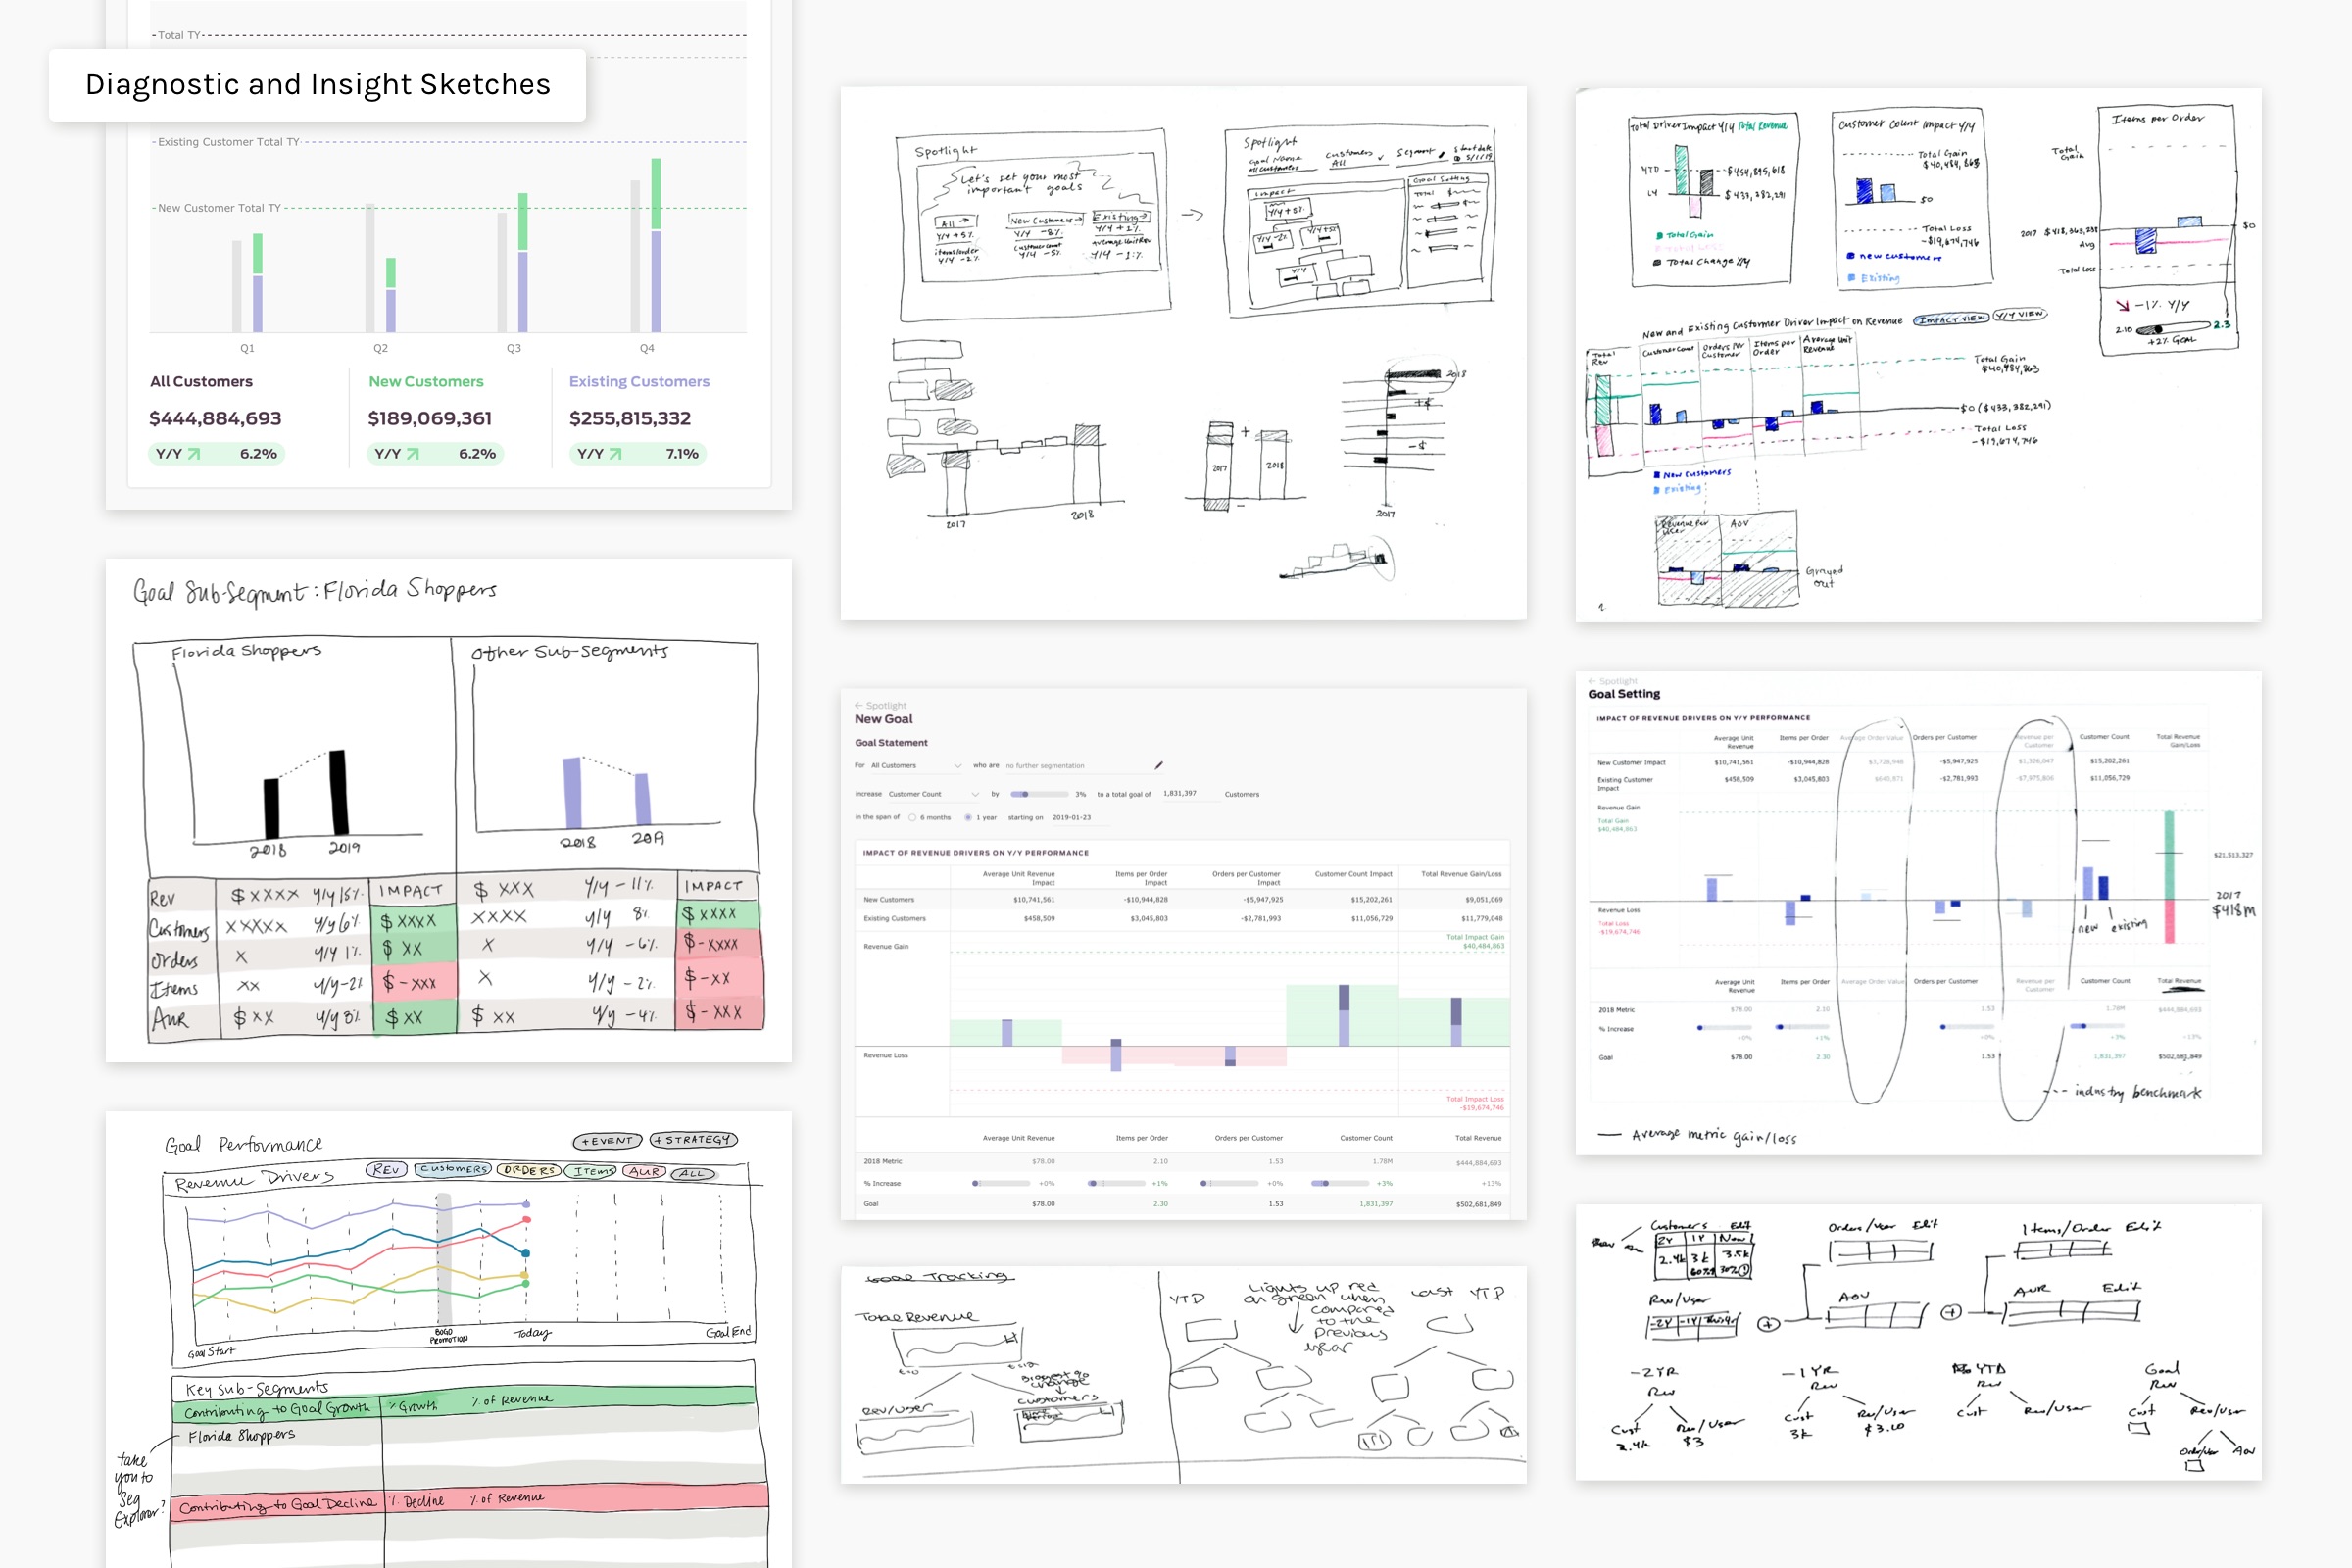
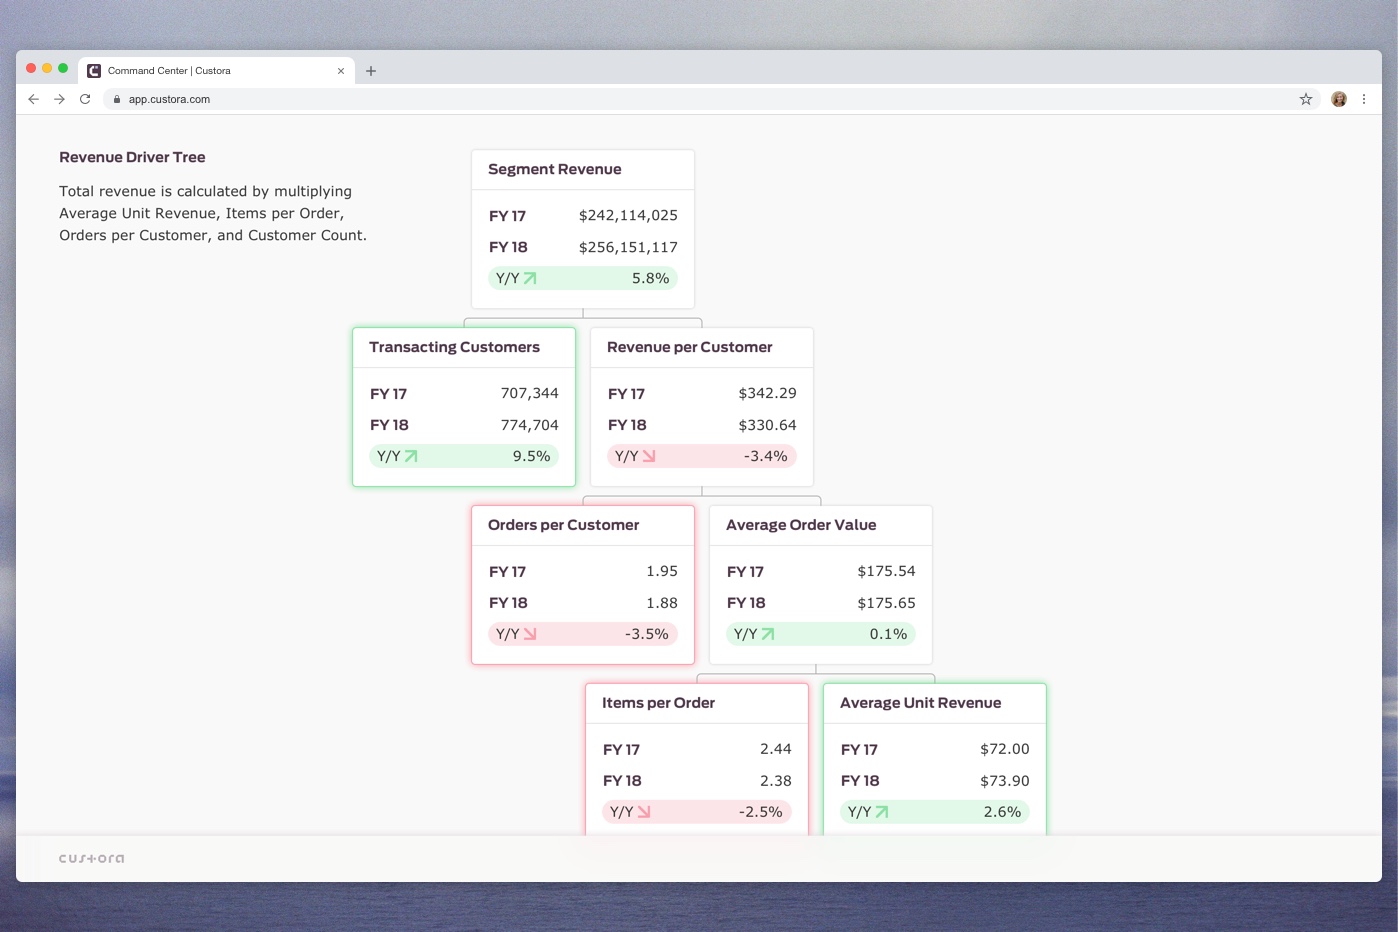
- Diagnostic: Diagnose the most compelling opportunities for a retailer to advance toward a particular solution by measuring how customer economic drivers have trended over time. Each driver points to a different set of potential strategies.
- Insights: Understand the greatest opportunities to advance toward a solution by seeing which products, promos, channels, and demographic segments are growing and declining.
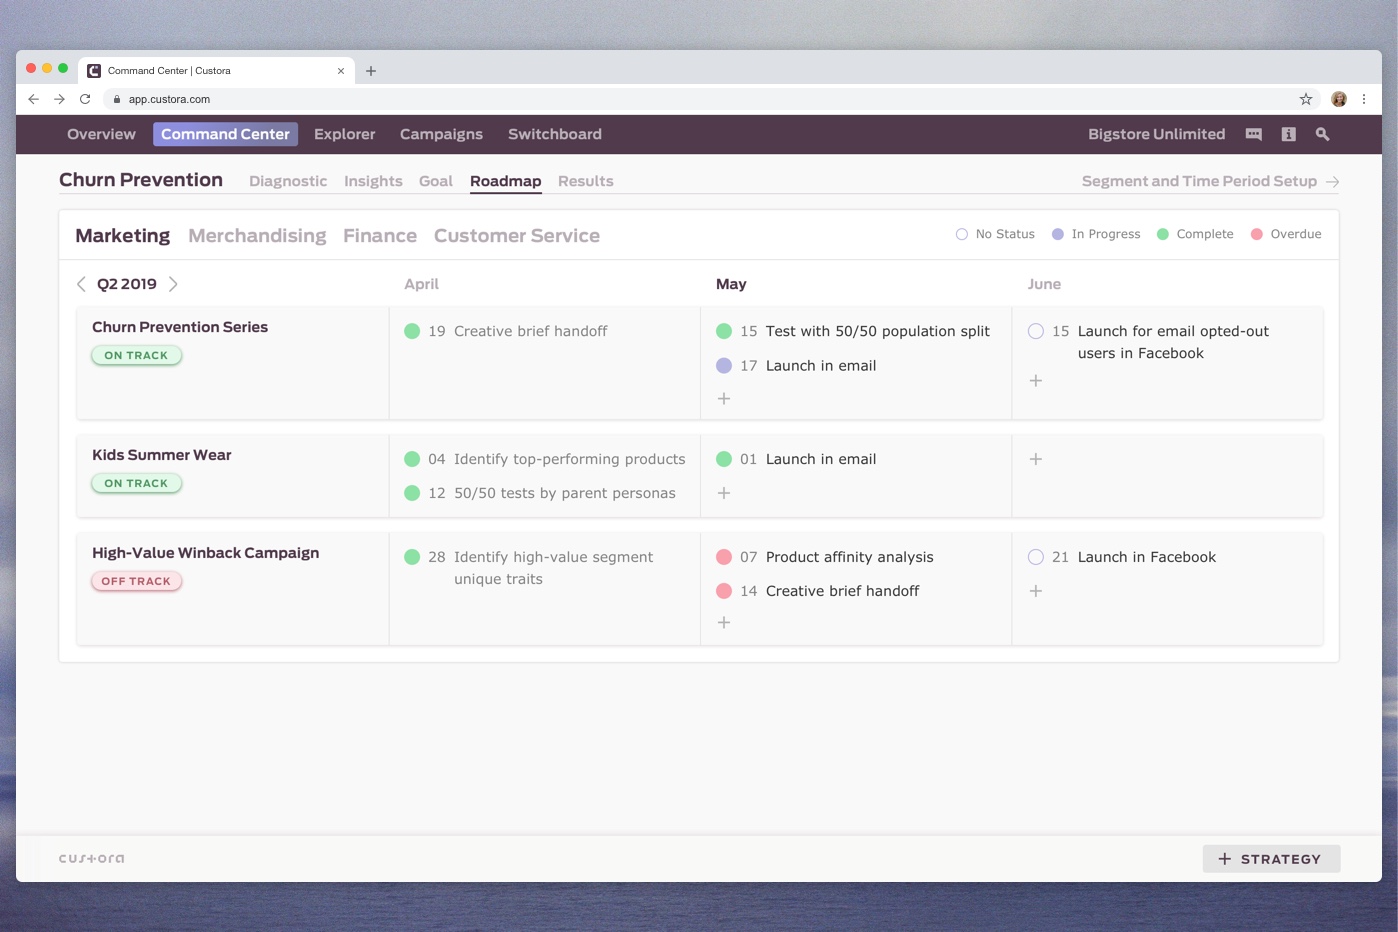
- Roadmap: Define and track team strategies by month so everyone is on the same page about what they're doing to achieve the org goal.
- Tracking Emails: A high-level assessment of goal progress. Gain insight on relevant sub-segments for your team, such as which departments are driving goal growth and which are causing loss. Track action plans and iterate based on the findings.
In addition to developing each new section of Command Center to address these issues, we worked hands on with Success to train them on the product, and modified our Sales process to focus on the methodology addressed in the product. After a month long beta with several retailers, we released Command Center to all users.


Project 2
Lead Product Designer
Worked with Design Director, two Engineers, and various stakeholders
2018-2019
Design System & Documentation
Lead Product Designer
Worked with Design Director, two Engineers, and various stakeholders
2018-2019
Creating a refined visual language for a Sketch symbol library and connected React components, accompanied by detailed docs for the org.
Problem
When I began working at Custora we had very little documentation on our visual and product design language, aside from assets collected in Dropbox. We did have a style guide, but it was inconveniently only accessible through the Custora app and rarely referred to.
- Engineers were building pages from scratch rather than using reusable styles and components, resulting in longer production times, inconsistencies between wireframe to live code, style differences between components, and ultimately a less than ideal user interface and experience
- Changes to the design system meant a tradeoff between product inconsistencies or spending time to retroactively update styles one by one
Outcomes
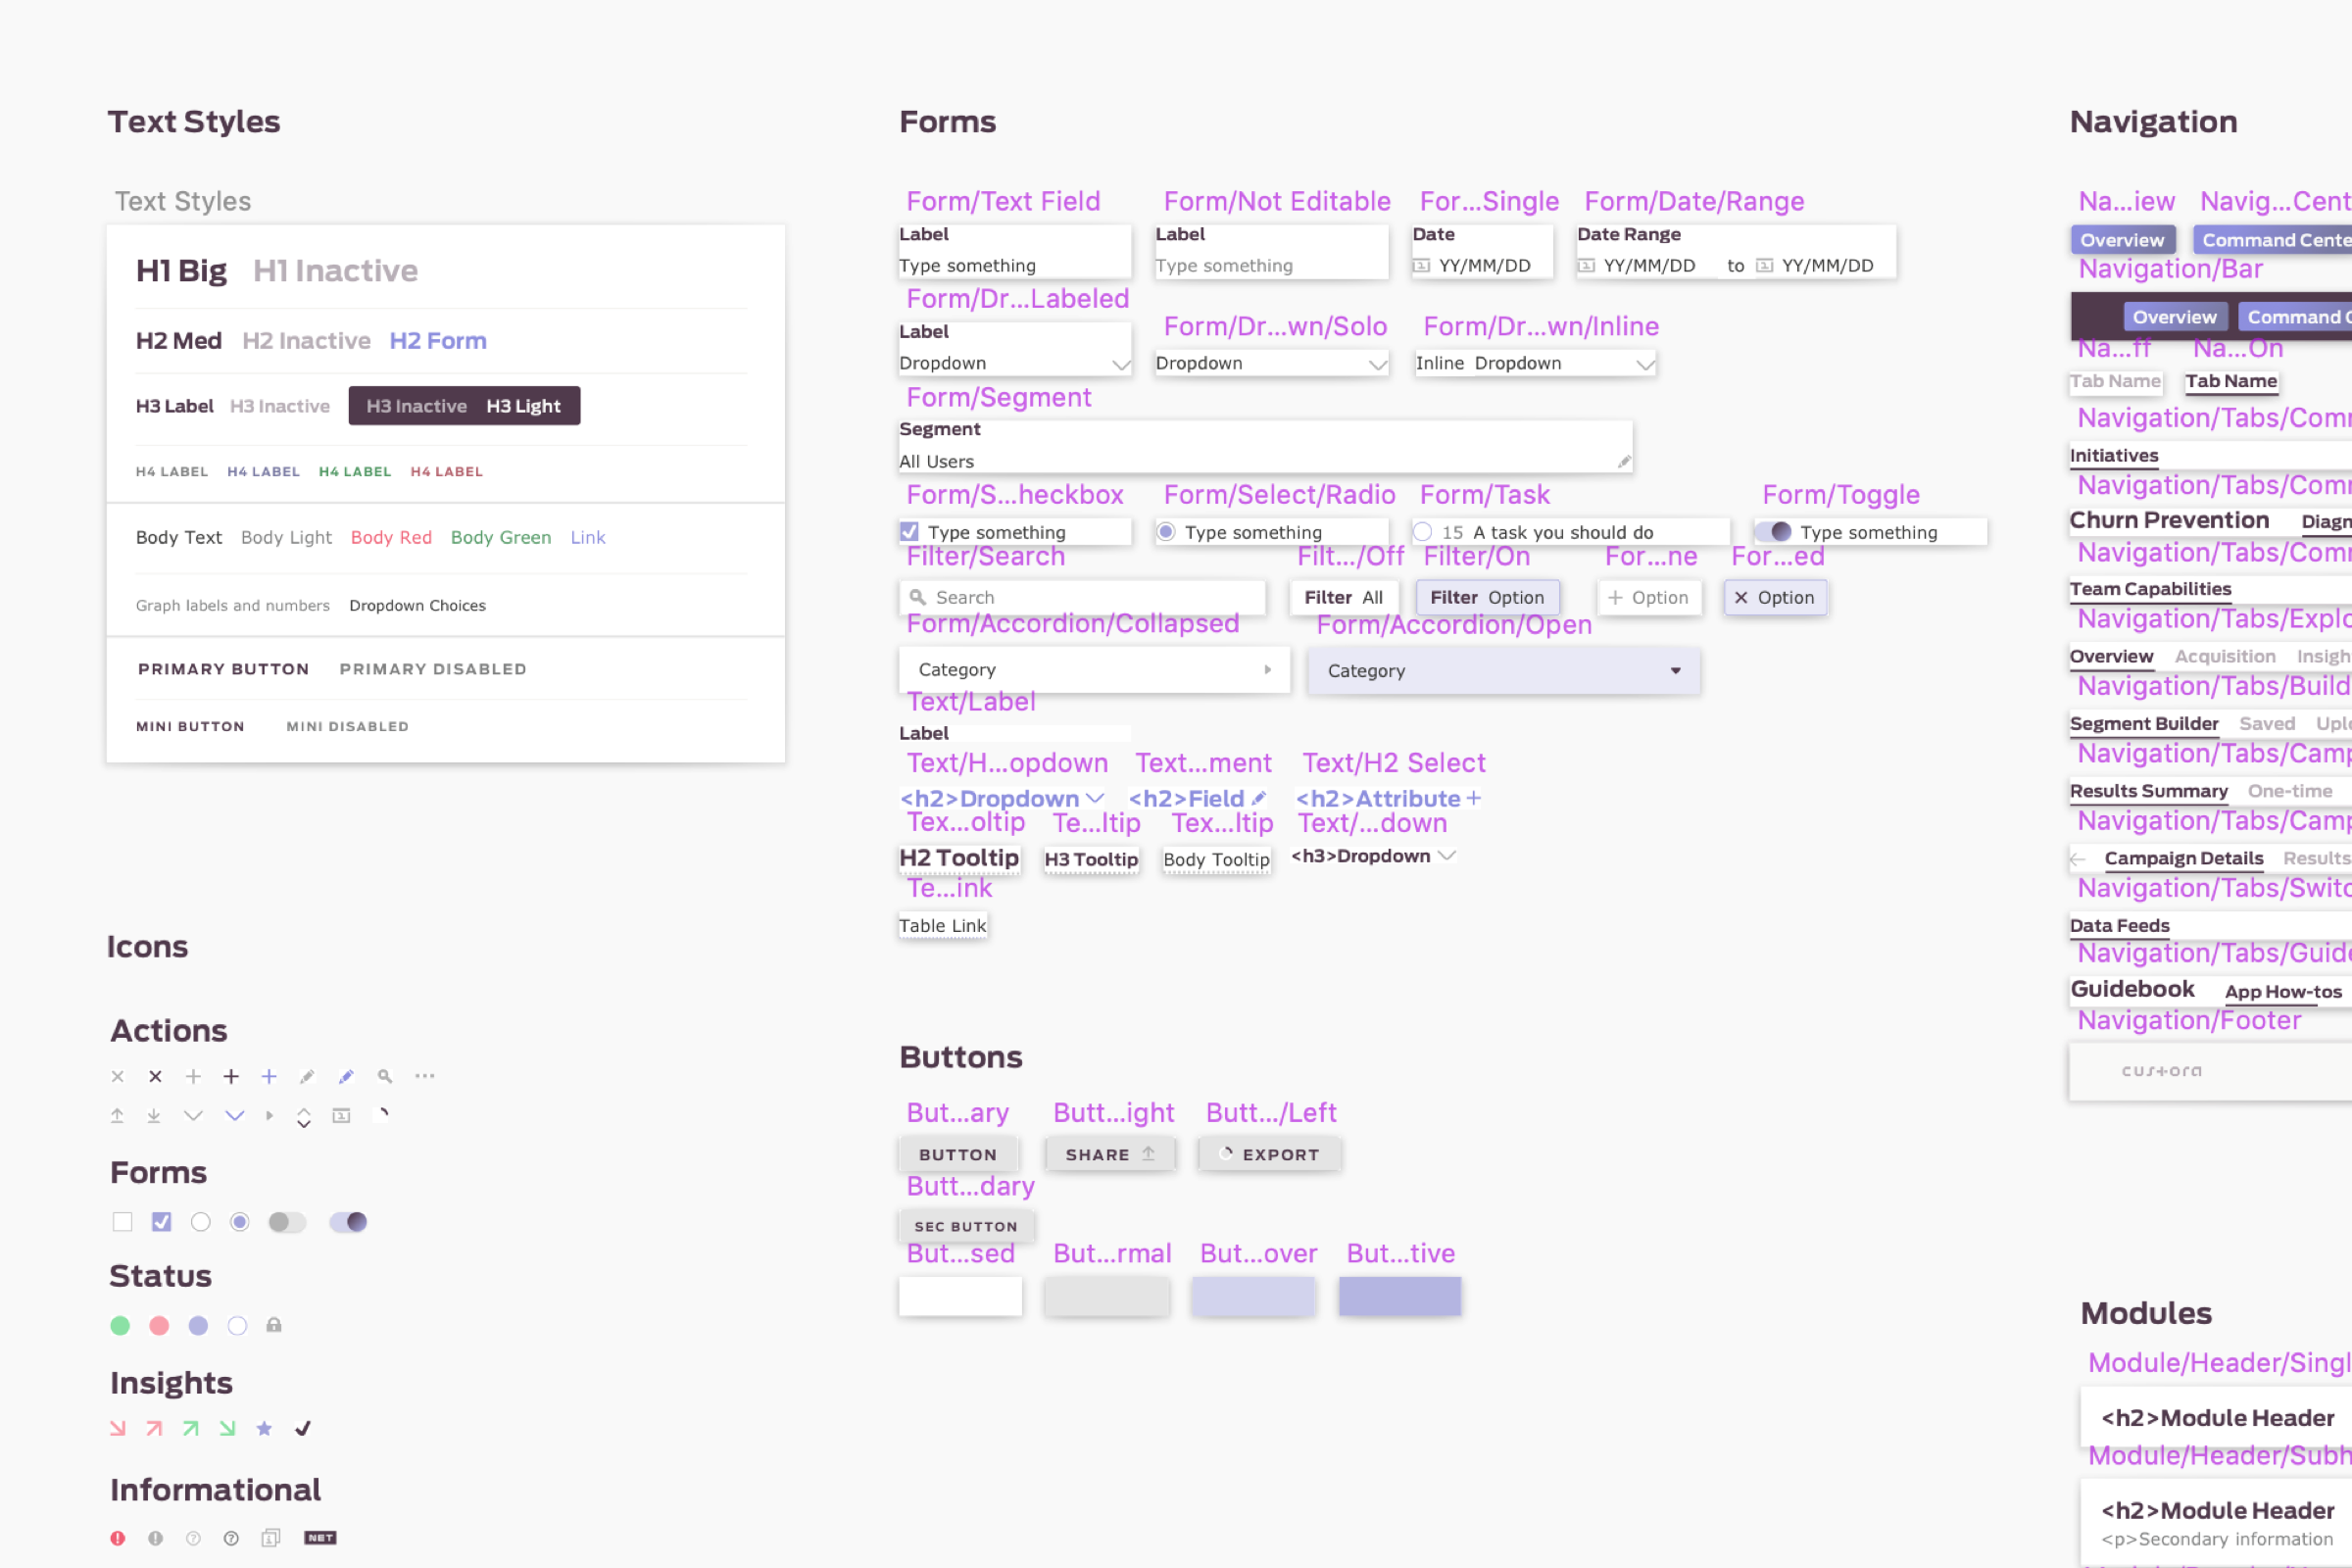
- Redesigned and reduced number of typography options and components in use, for a simplified, beautiful user interface and experience
- Custora Cue UI: Sketch symbol library with everything needed to create consistent wireframes: type styles, type combinations, color palette, icons, form components, navigation elements, buttons, module parts, modals, and more
- React components for streamlined and consistent code production
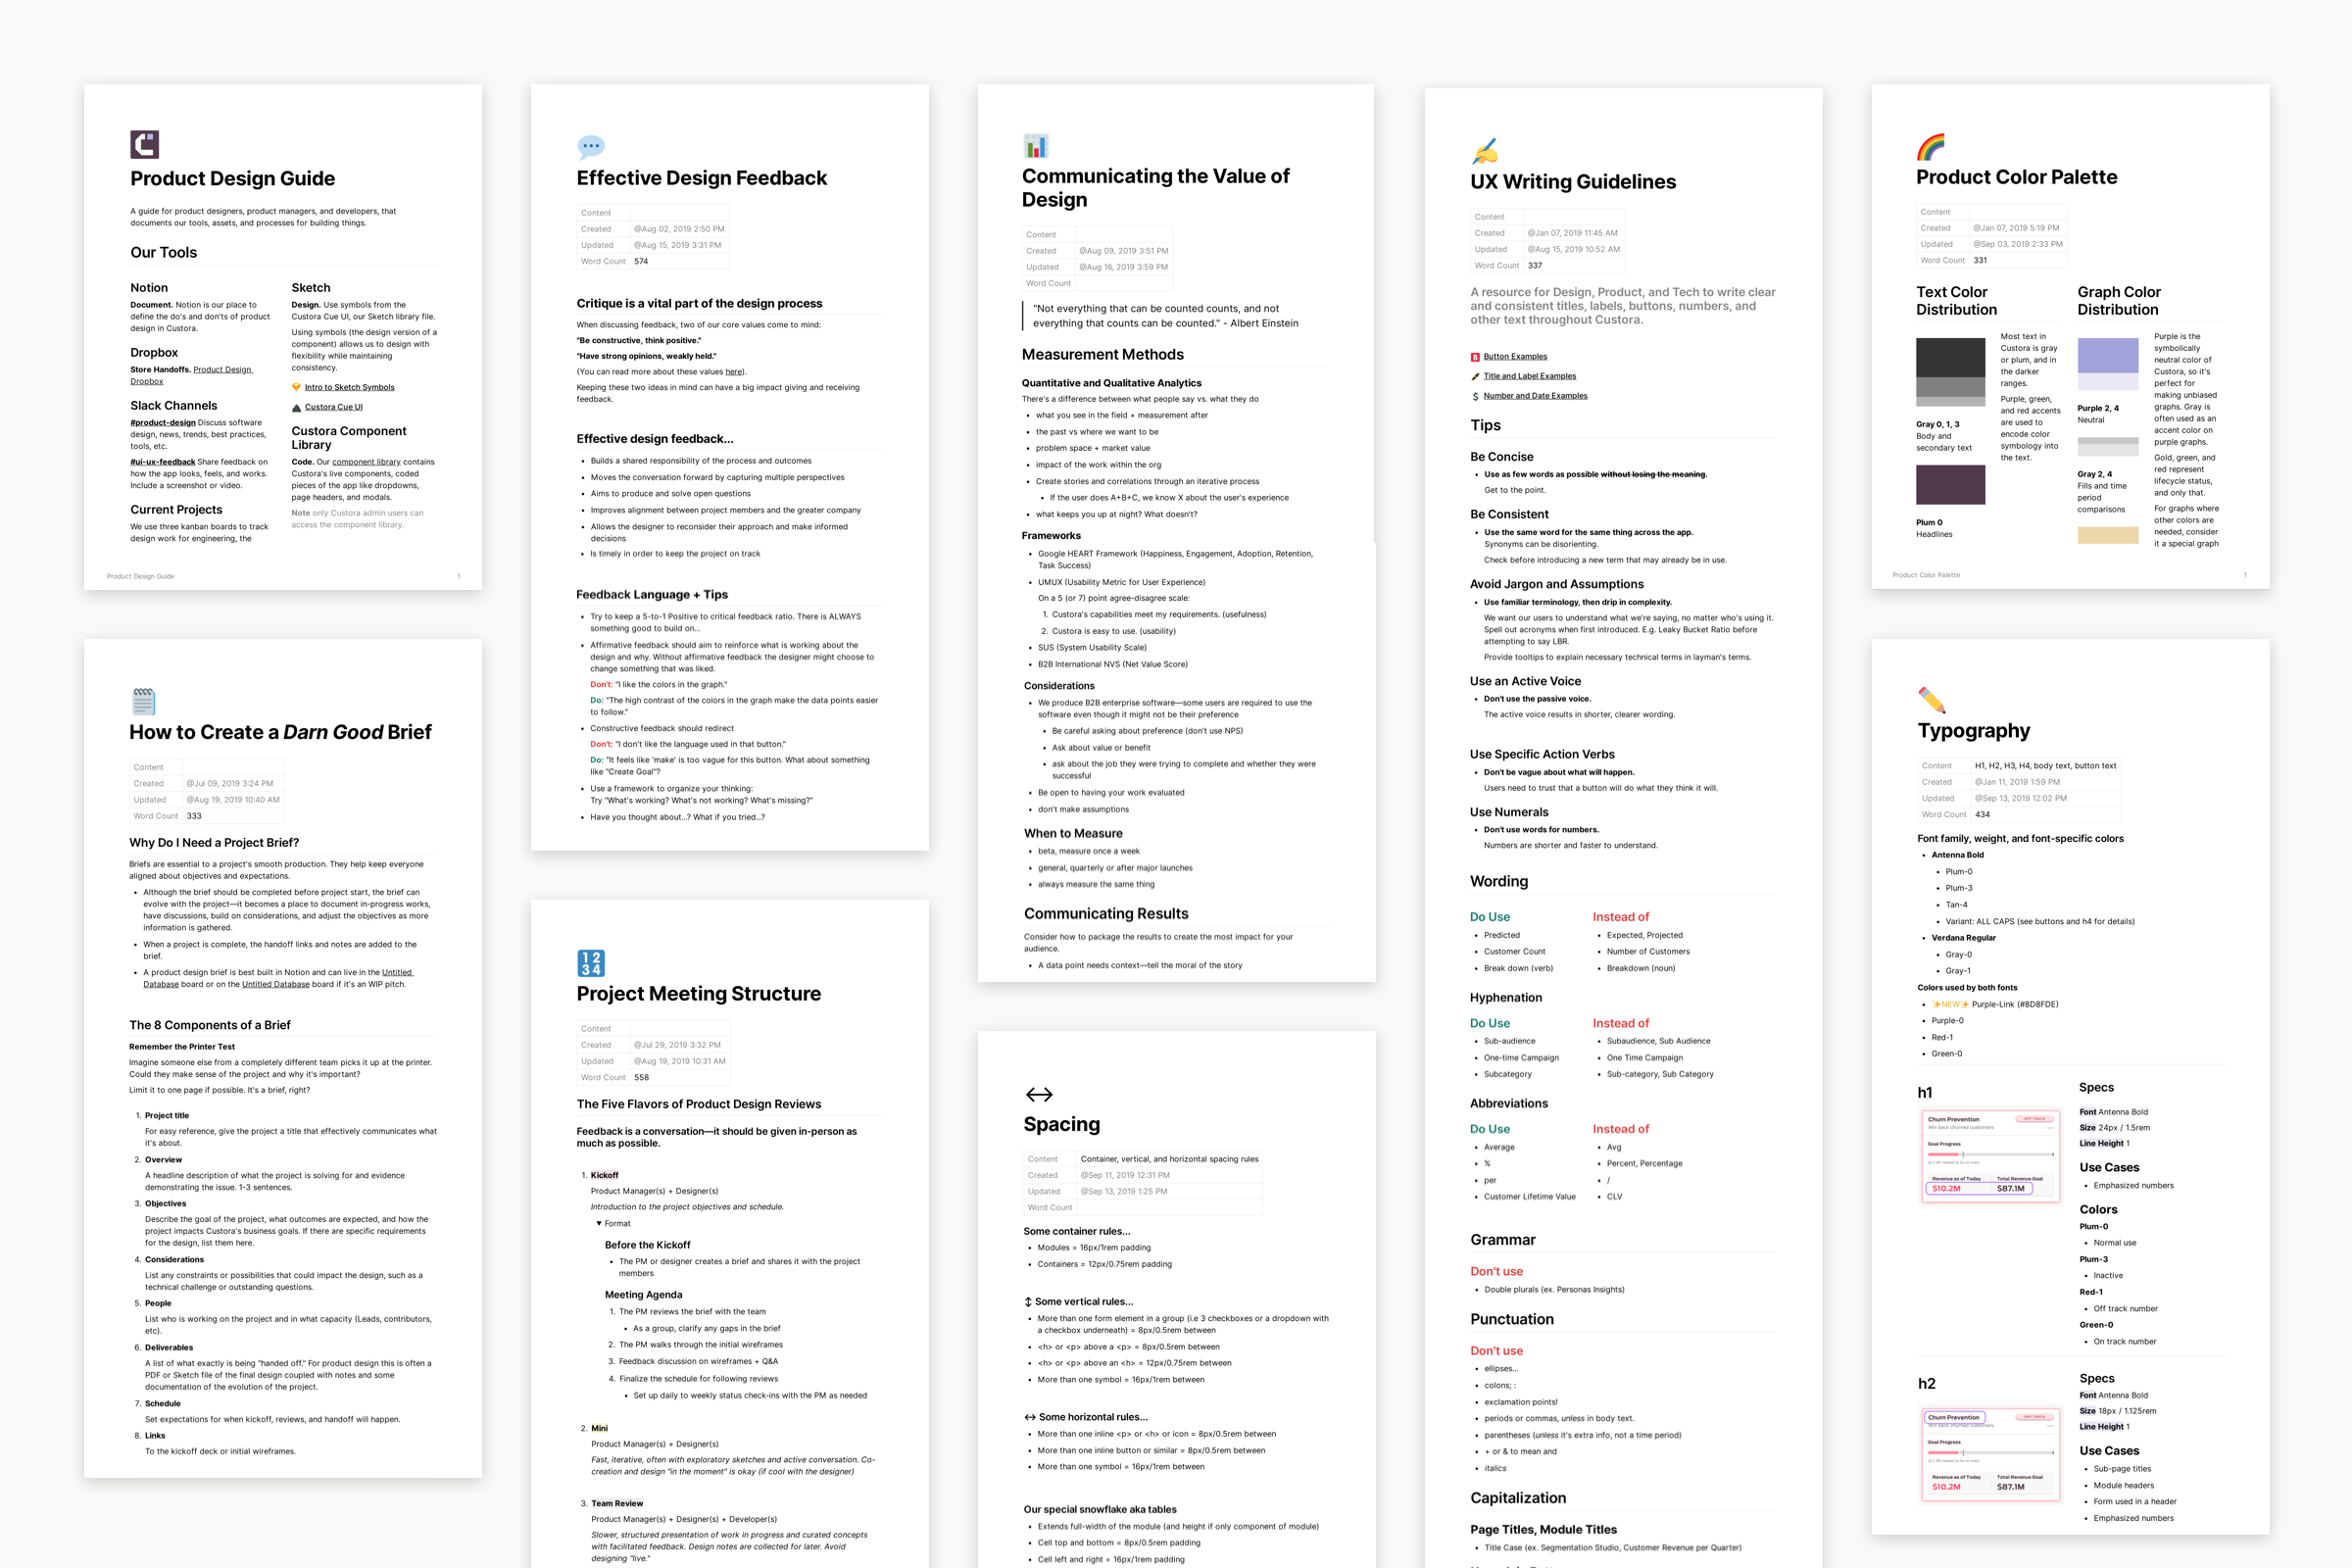
- Product Design Guide: 5,000+ words of written Notion documentation on product design processes and UI system, creating a source of truth for collaboration
- Data Viz Guide: Keynote document with instructions and assets for creating data visualizations using best practices
- Slack feedback channel: A way for Custorians to share feedback on the way the app looks, works, or feels, especially for small non-bug items that otherwise wouldn’t make it into the product cycle
- Design Week: One week during each product cycle to implement design-driven changes from feedback or continue on design consistency projects from a code perspective


Process
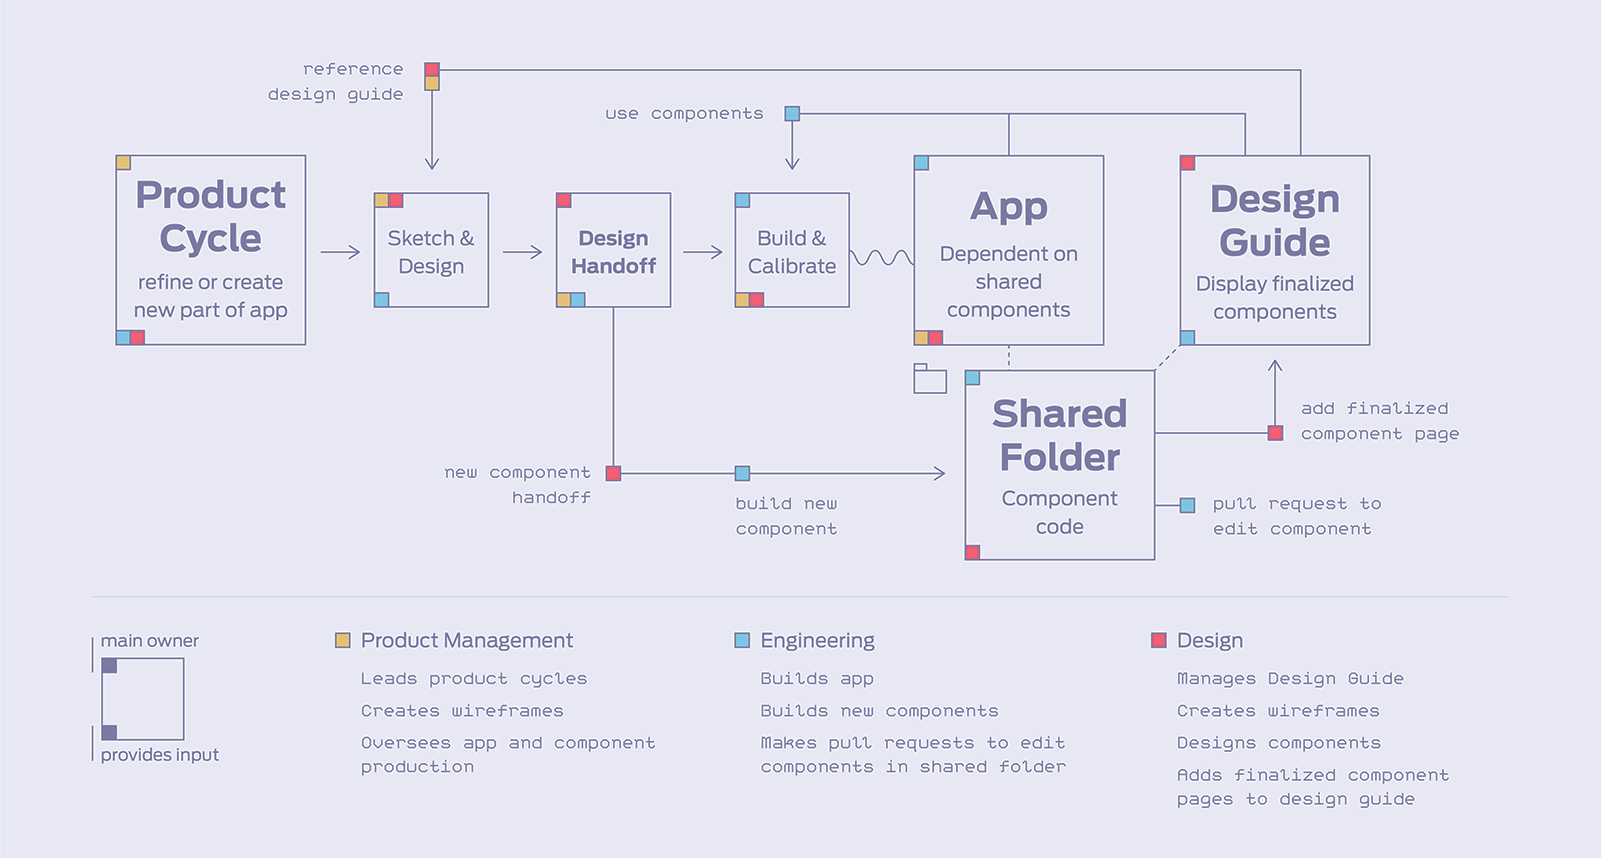
We were inspired by the interactive component libraries such as Shopify Polaris and Atlassian. Their libraries eased code production and output of high-quality, consistent products. We sought to build a similar reference guide and component library.
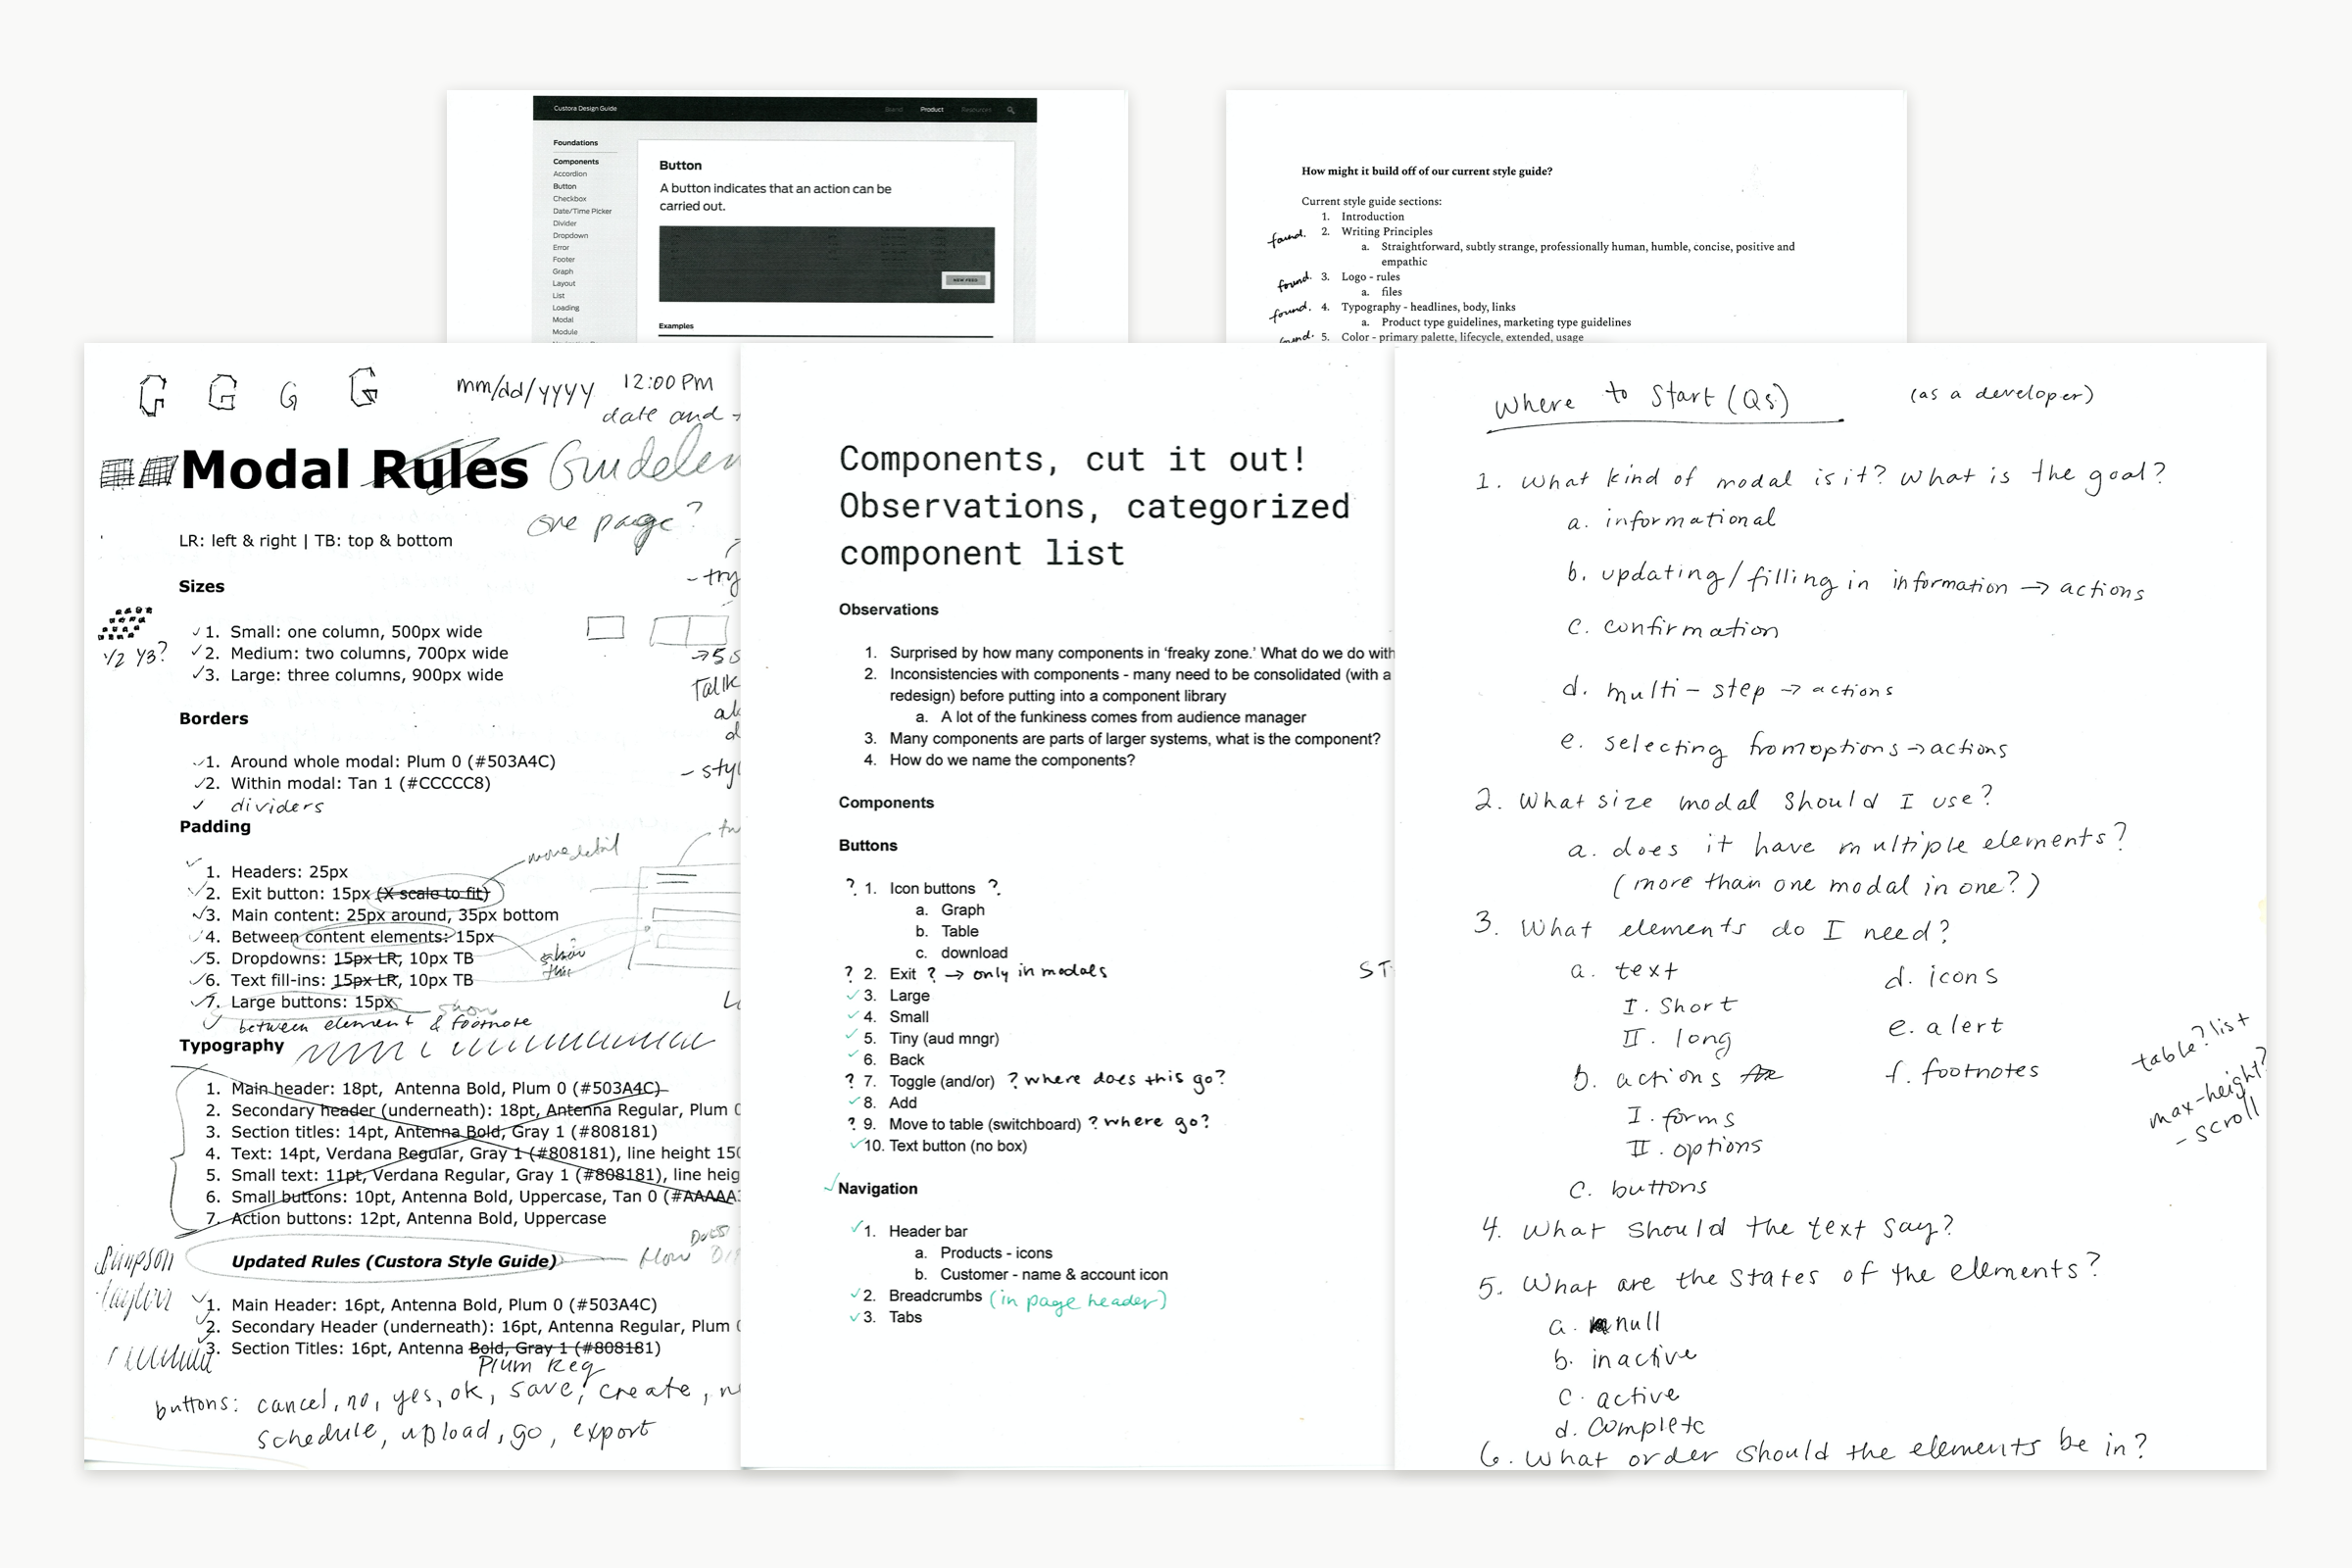
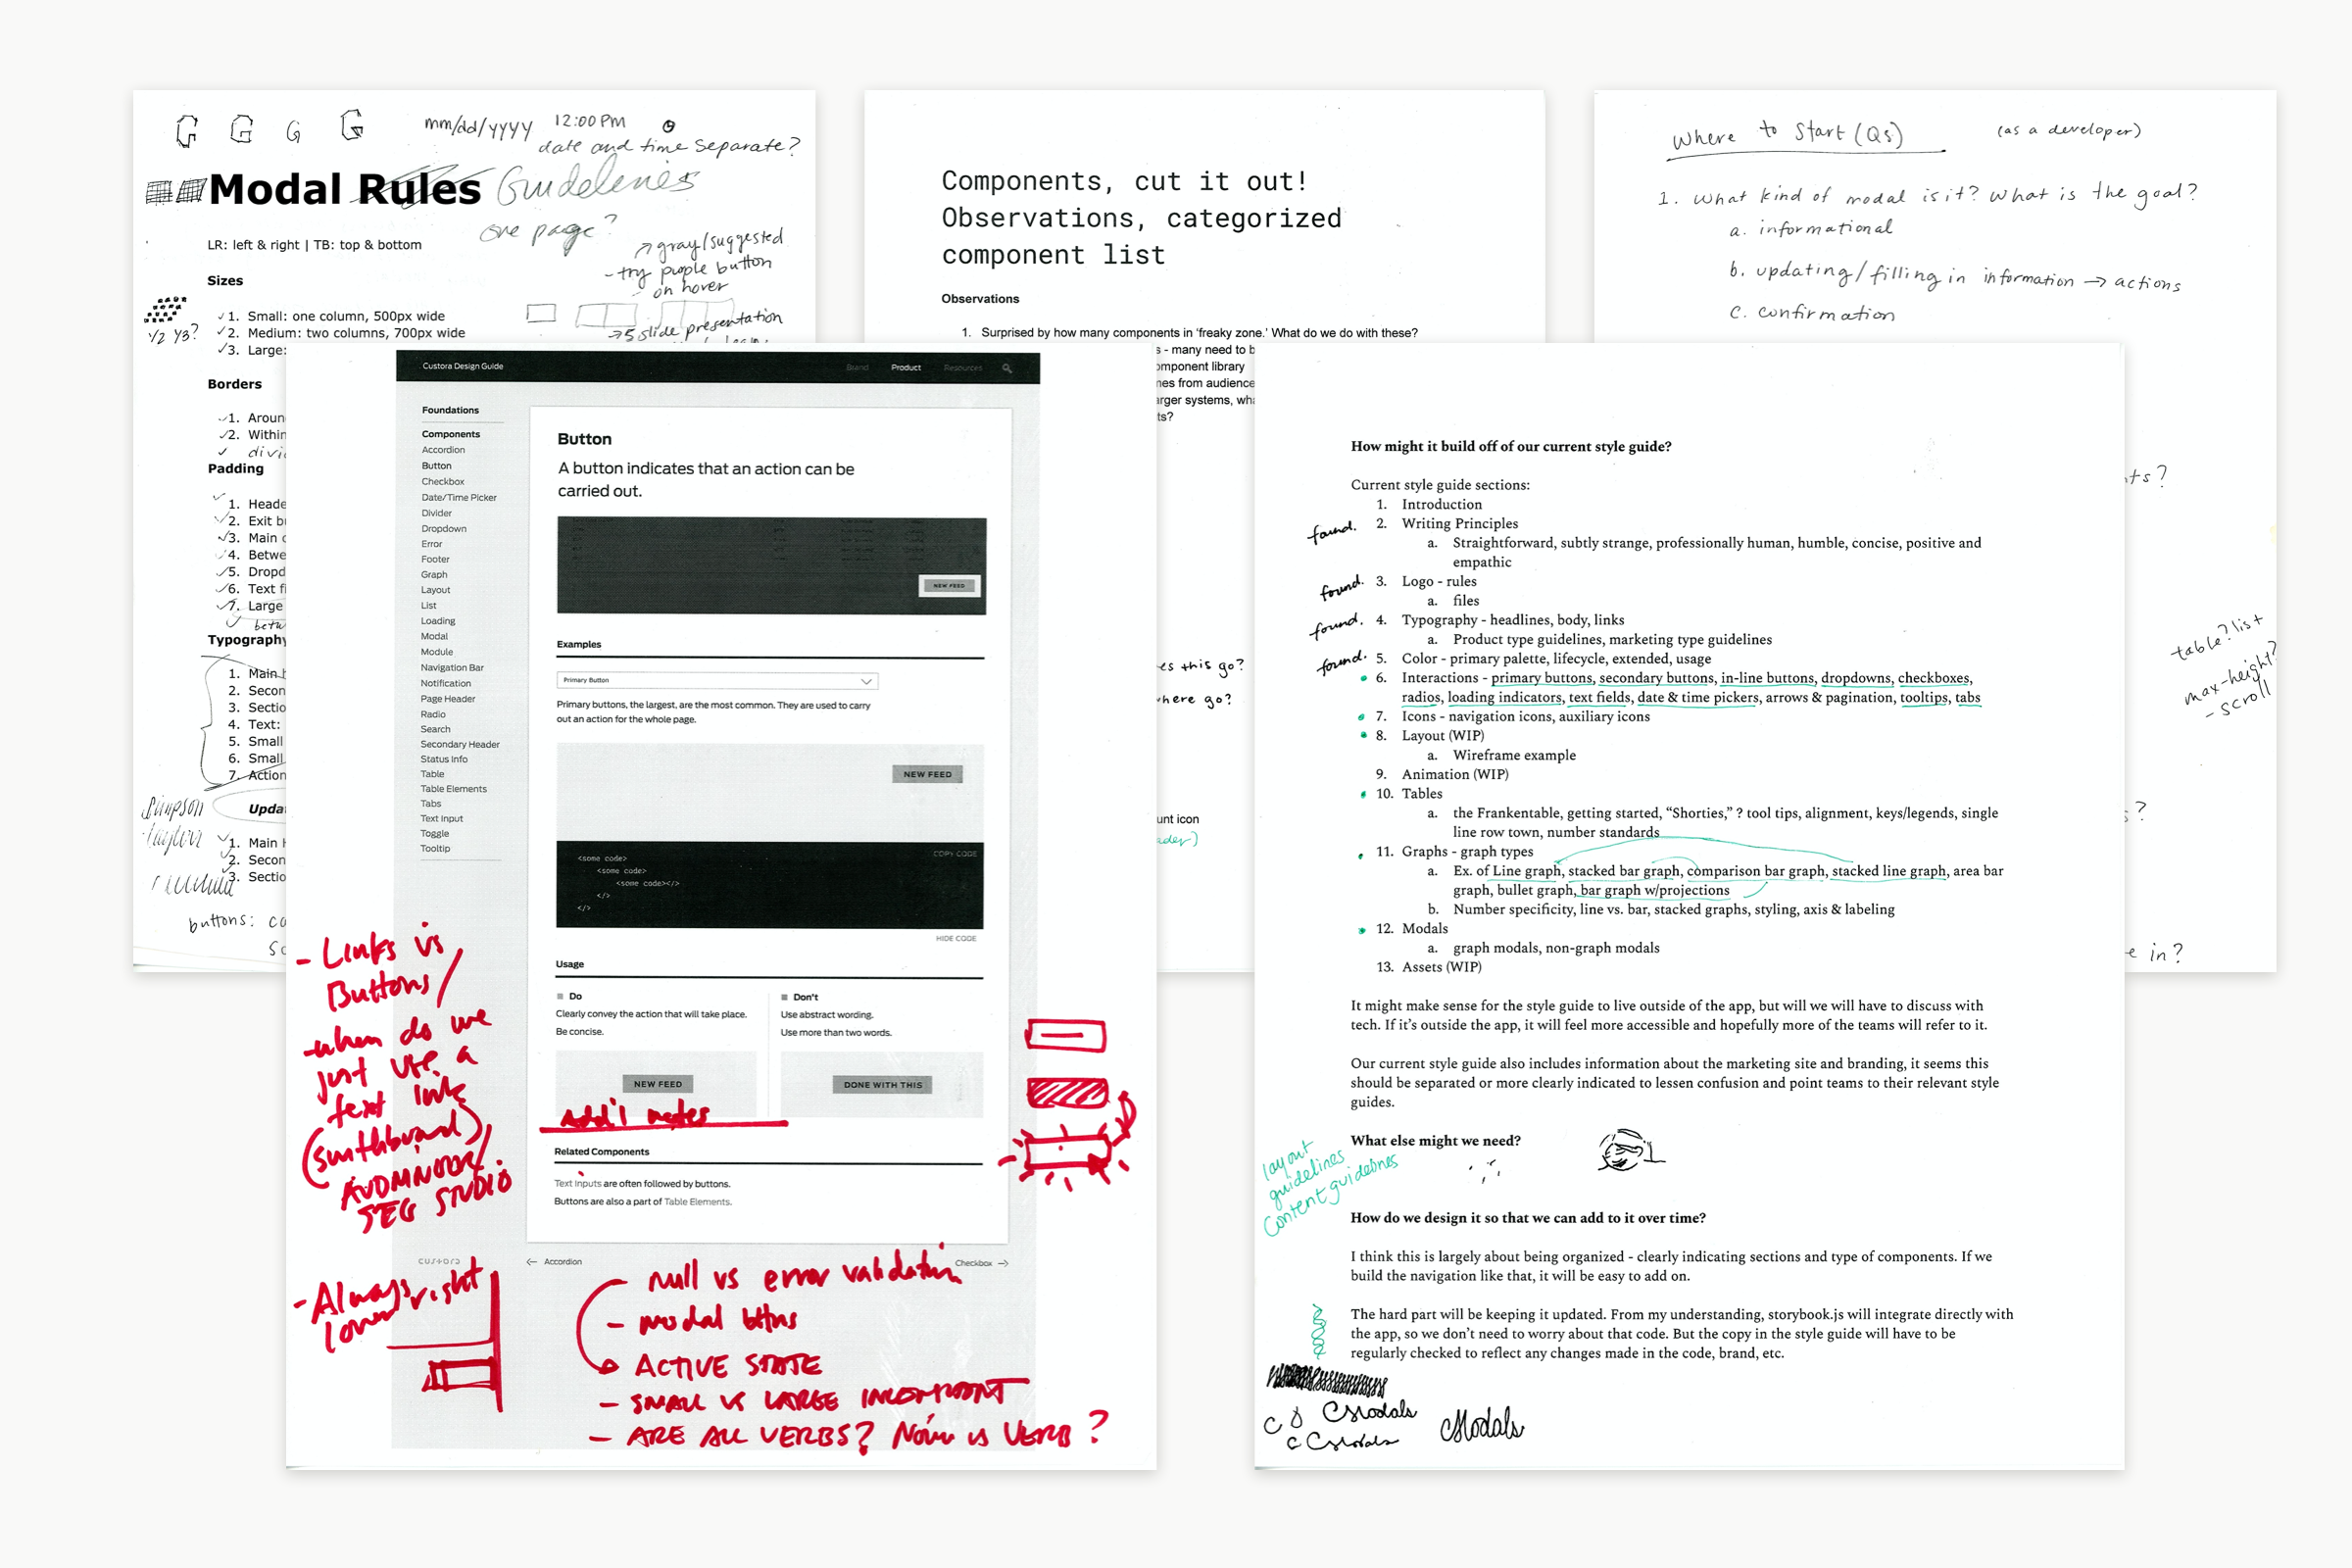
We began workshopping by collecting and identifying existing components and variations used in the app. Before we could redesign or add in new components, we found it necessary to reduce the number of design variations to the most essential.
Our engineering team began building reusable components with React and using Storybook for code documentation. Next, I took the initiative to build our own library site using React, wrote documentation on design best practices, and worked with another designer to display the live components and code on the site. Collaboration and upkeep of the site was difficult though–I was the only desginer who knew the code base and the engineering team had other priorities–so eventually we scrapped the site in favor of Notion.
Although we couldn’t link live components to Notion, it allowed us to be more collaborative in creating and sharing documentation, as all of the product and engineering members were using it for cycle planning and tech docs.
When we created the new Segment Overview, we had the opportunity to reassess our design system and update the style of some components. We were previously using Adobe Illustrator for product design work and decided to move to Sketch.
With Sketch we were able to rebuild our current system to resemble the function of the code–changes to symbols would be represented everywhere they were used. Using the system to build the Segment Overview page, it was easy to identify where it was lacking and how our style could be modernized. Over subsequent product cycles the design system was further refined to improve type, hierarchy, reduce data ink, and simplify interactions.
Project 3
Lead Product Designer
Worked with two Product Managers
2019
Overview Dashboard
Lead Product Designer
Worked with two Product Managers
2019
Research and validation to update the Overview dashboard, Custora’s landing screen.
Problem
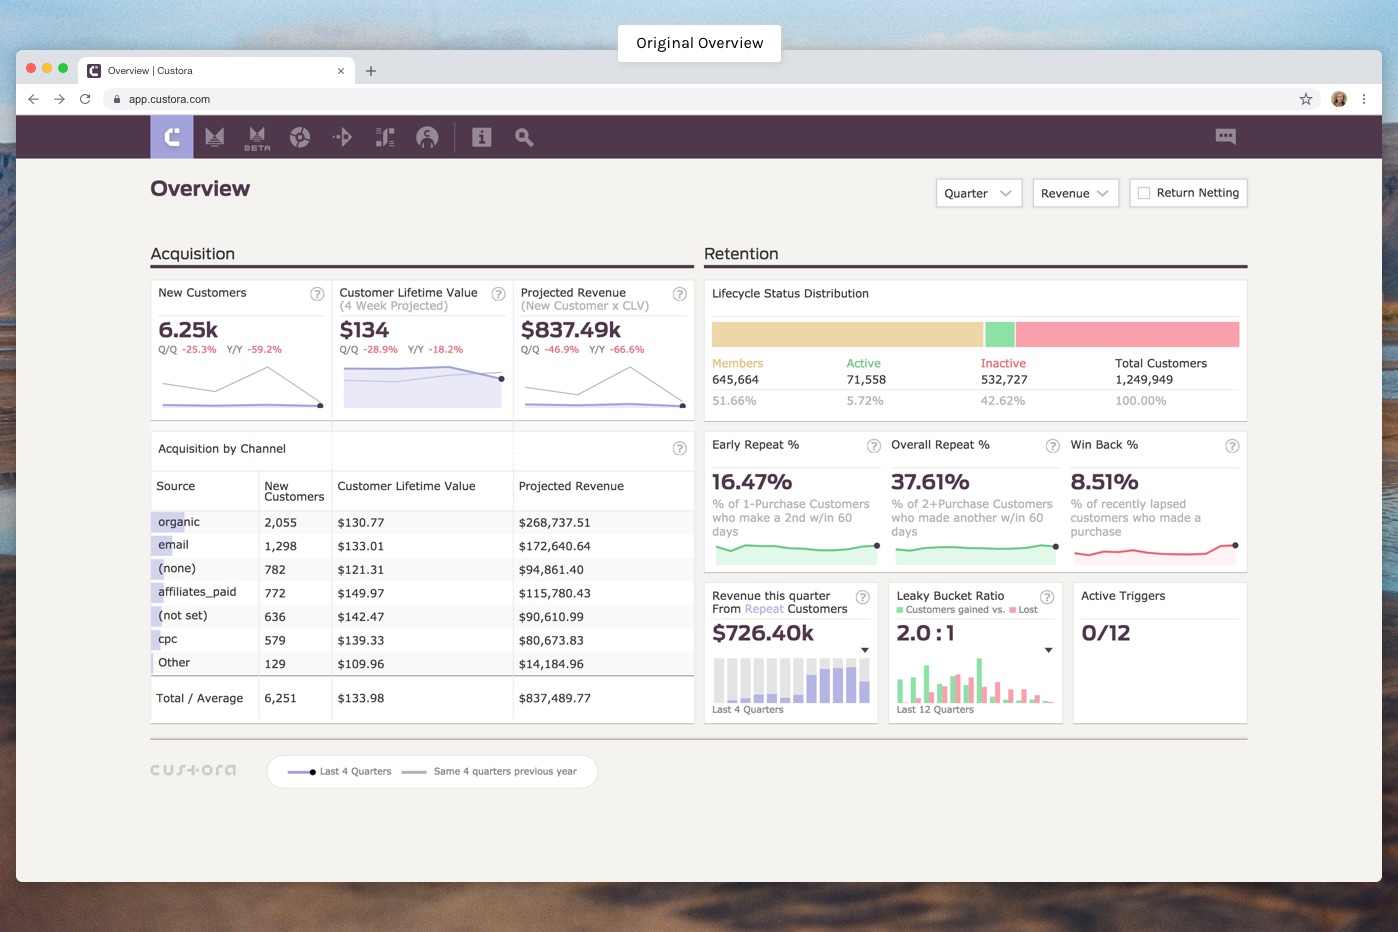
- The Overview dashboard hadn’t been updated in over five years–in that time we learned more about what it takes to make customer data useful for insights and activation, our market evolved, and so did Custora
- We needed a landing screen that would match the level of our new release, Command Center
- We received direct feedback that the dashboard was inflexible–the view couldn’t be changed to show different metrics or filtered aside from simple date ranges such as month or quarter
- From a business perspective these facts made it difficult to land and renew contracts
Outcomes
Custora was acquired in November 2019 during the research and development phase of this project, and all work halted. Word of the overview redesign saved a customer relationship, resulting in a renewed contract when we expected otherwise.
- We ended with two sets of wireframes we were ready to continue user conversations with
- We felt good about our general groups of metrics–overall business performance, acquisition, cultivation, and churn–but there was plenty of further research to do
- We needed to nail down functionality before moving on to a more detailed design phase
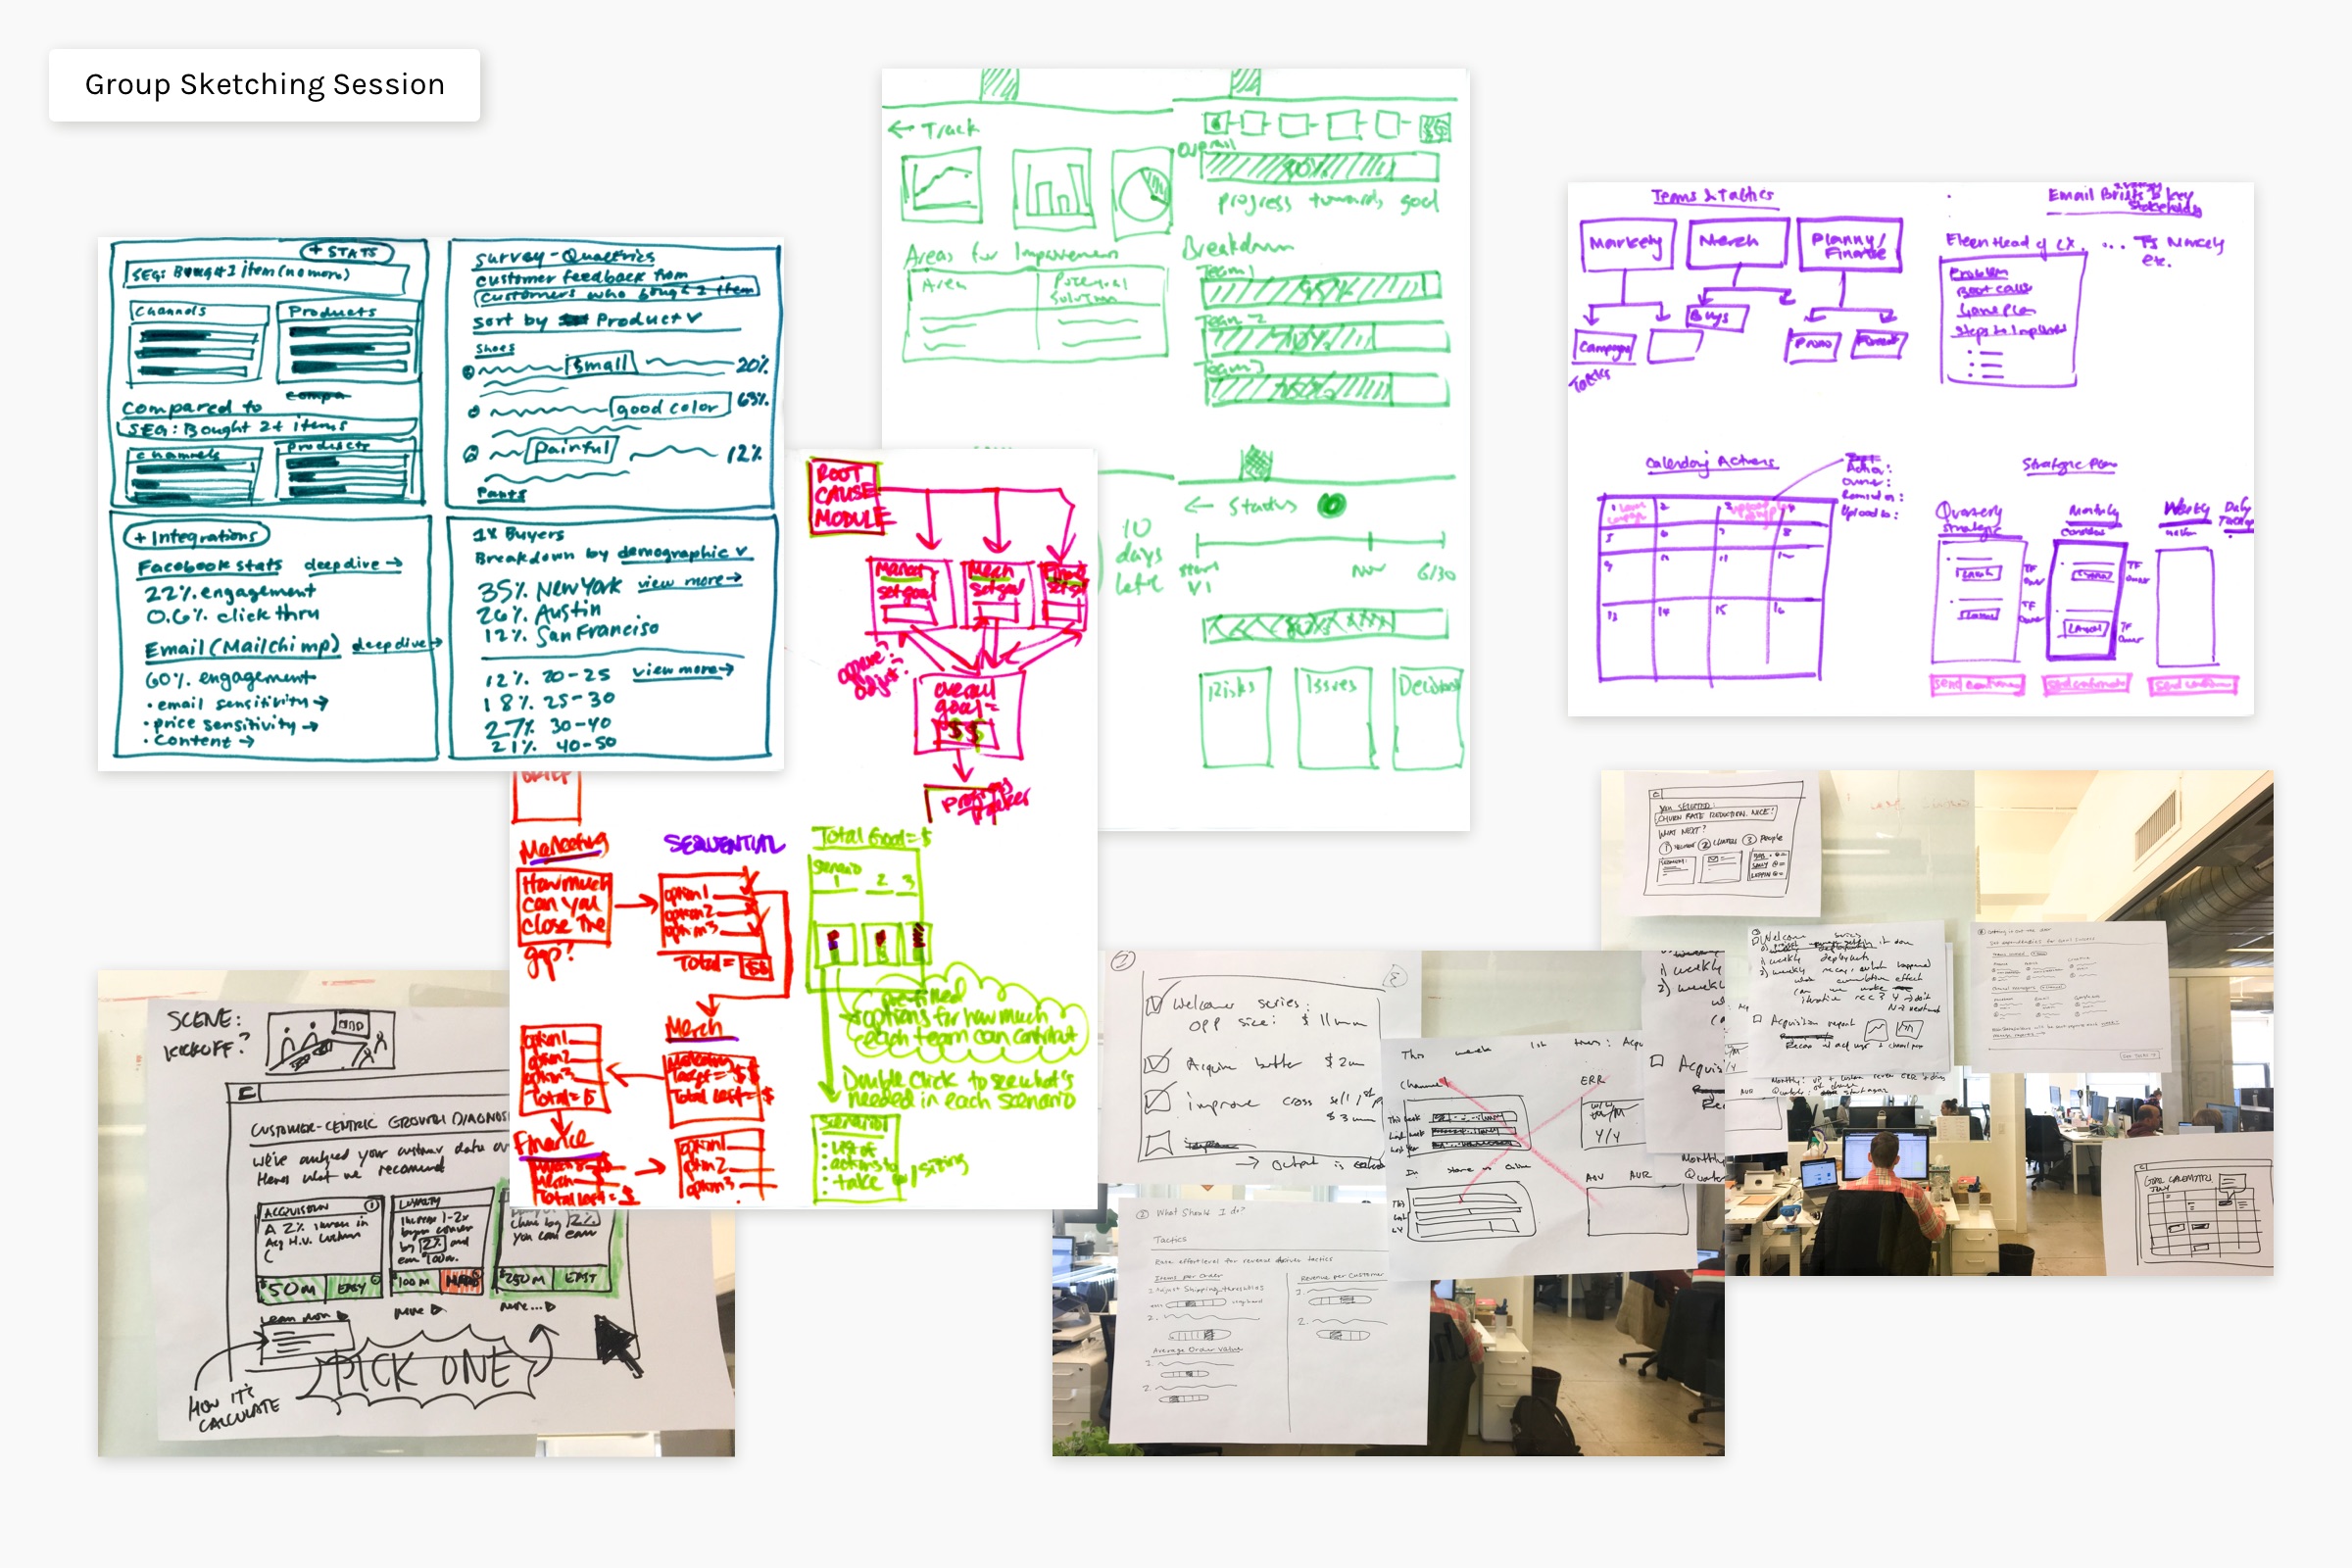
Process
During Custorathon, Custora’s bi-annual hackathon, I teamed up with our head of product and customer enablement director to hash out the initial project steps: understanding why we decided the Overview needed an update, who we were designing for, and key questions we needed to test our hypotheses.
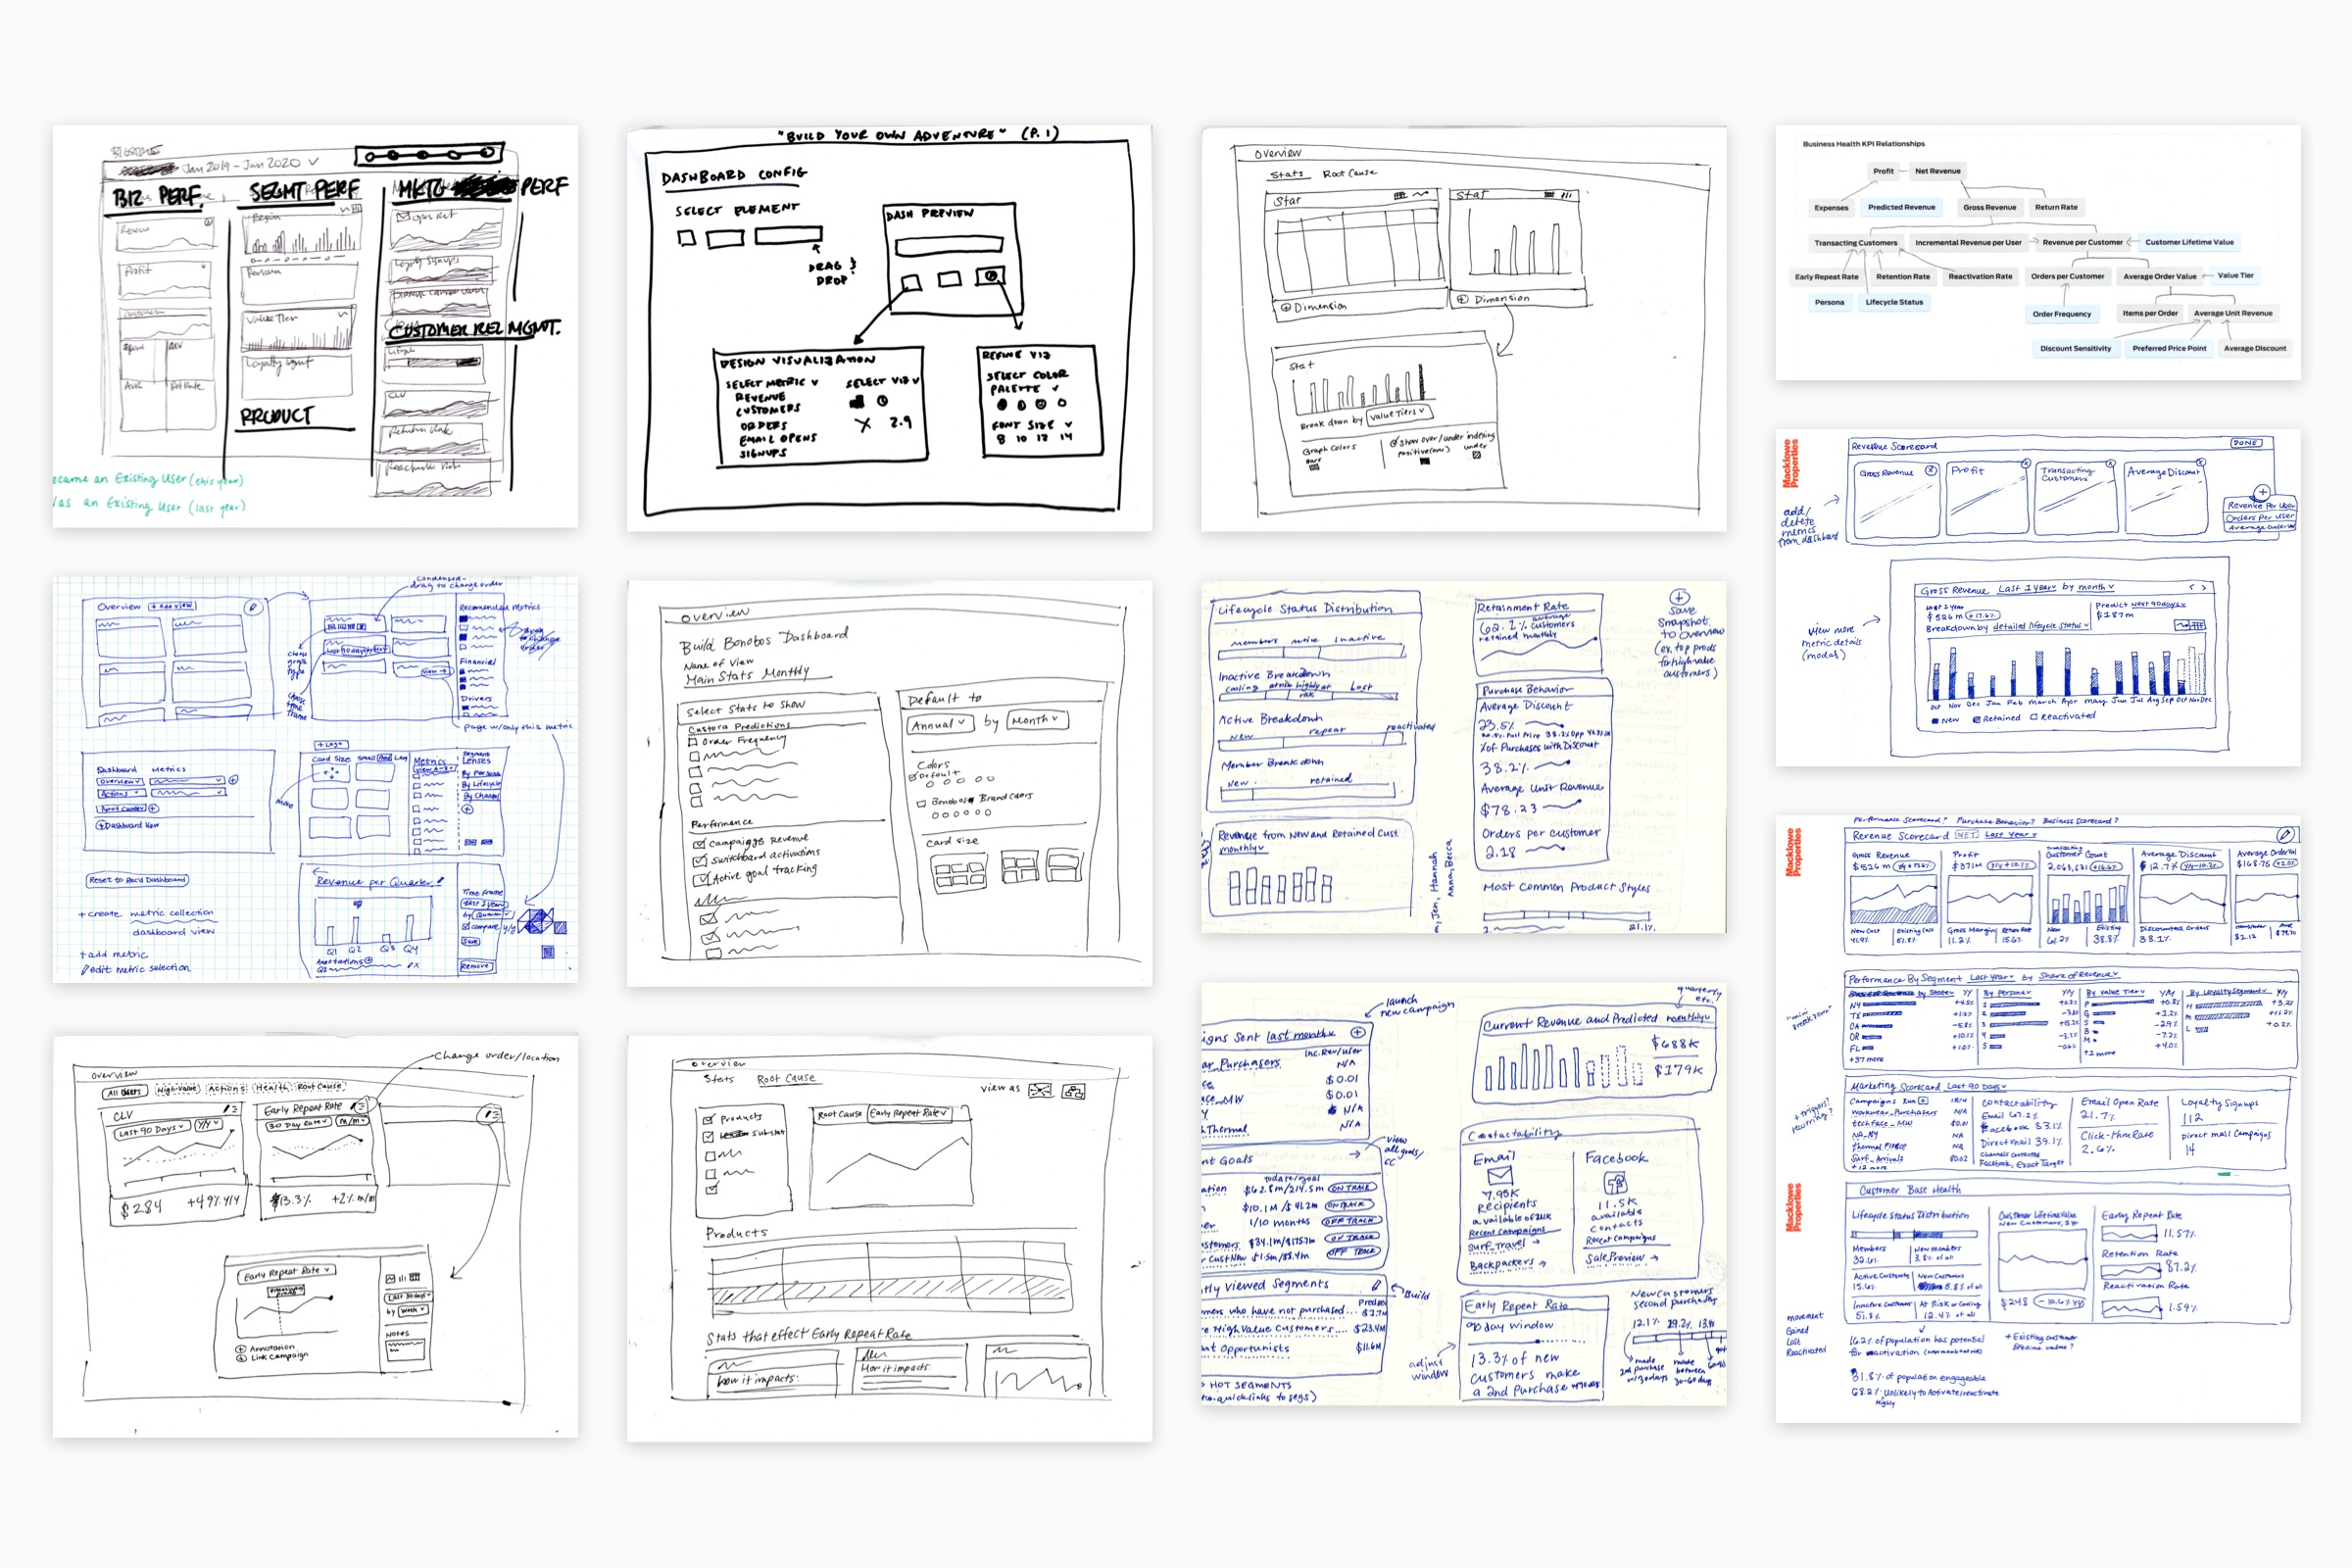
To spur conversation we dug up overview reports that our users shared with us–analyzing the metrics they used, the functionality, and their viewpoints. We also looked at other SaaS dashboards and sketched our ideas to understand where we aligned and what was missing.
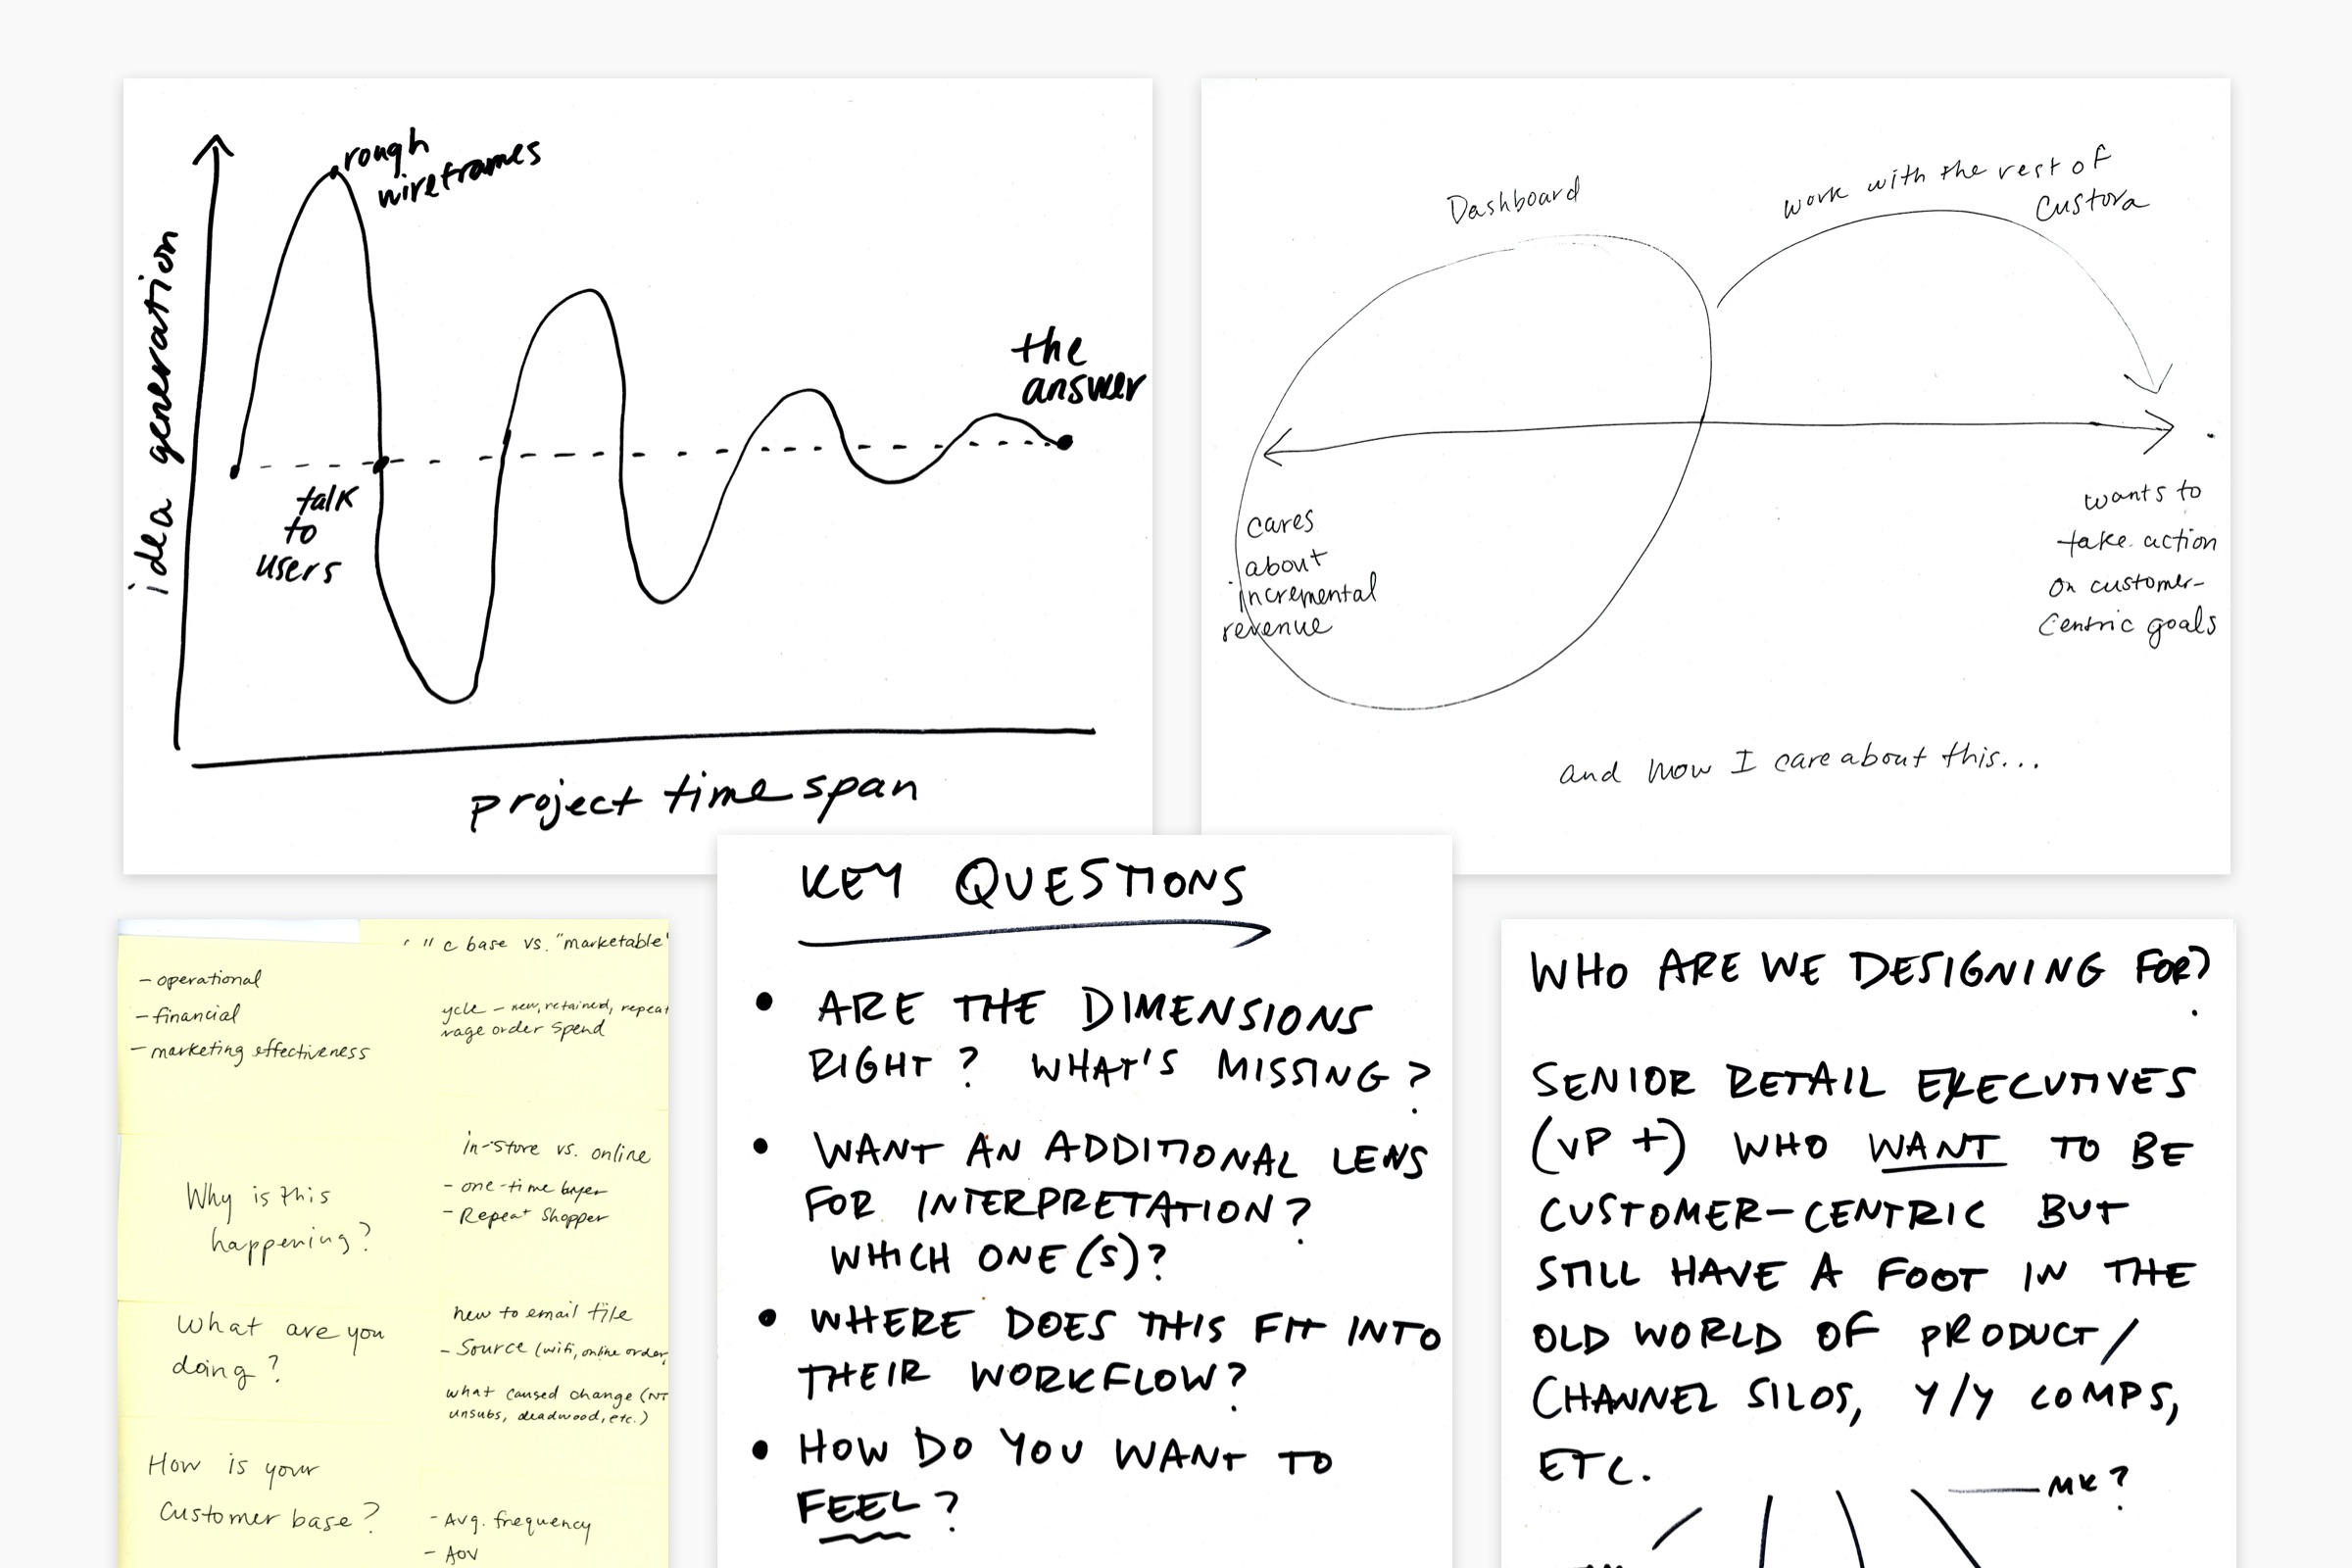
Questions
Our Hypotheses
- Purpose: Is an overview the right landing screen for Custora? What should it answer: what/why/how? What’s important, the emotional power of a dashboard or inciting action?
- Metrics: Level of detail? How many? What is useful in the current dash? What’s missing?
- Functionality: How prescriptive or customizable should the view be? What does customization mean to our users? How much is enough?
- Distribution: Who is viewing the info and how? In-app, email, excel? How do they want to share and with whom?
Our Hypotheses
- Flexible: Our customer base is diverse. Organizations prioritize information differently and have different processes for decision-making. We should provide enough flexibility to accommodate the diversity of the orgs we serve.
- Simple: Our current design includes many predictive metrics–but there is an opportunity for us to increase adoption by placing greater emphasis on explanatory, historical metrics.
- Comprehensive: For many retailers, we operate as their sole lens into their customer data. We have an opportunity to highlight key drivers of business performance across the breadth of data that we're capturing.
- Customer-Centric: We should accommodate the spectrum of our users’ customer-centricity maturity, but provide a way to ‘level-up’ to the Custora view.
- Main questions the dashboard should answer: What is the health of my customer base? Why are these trends happening? Are my actions effective?
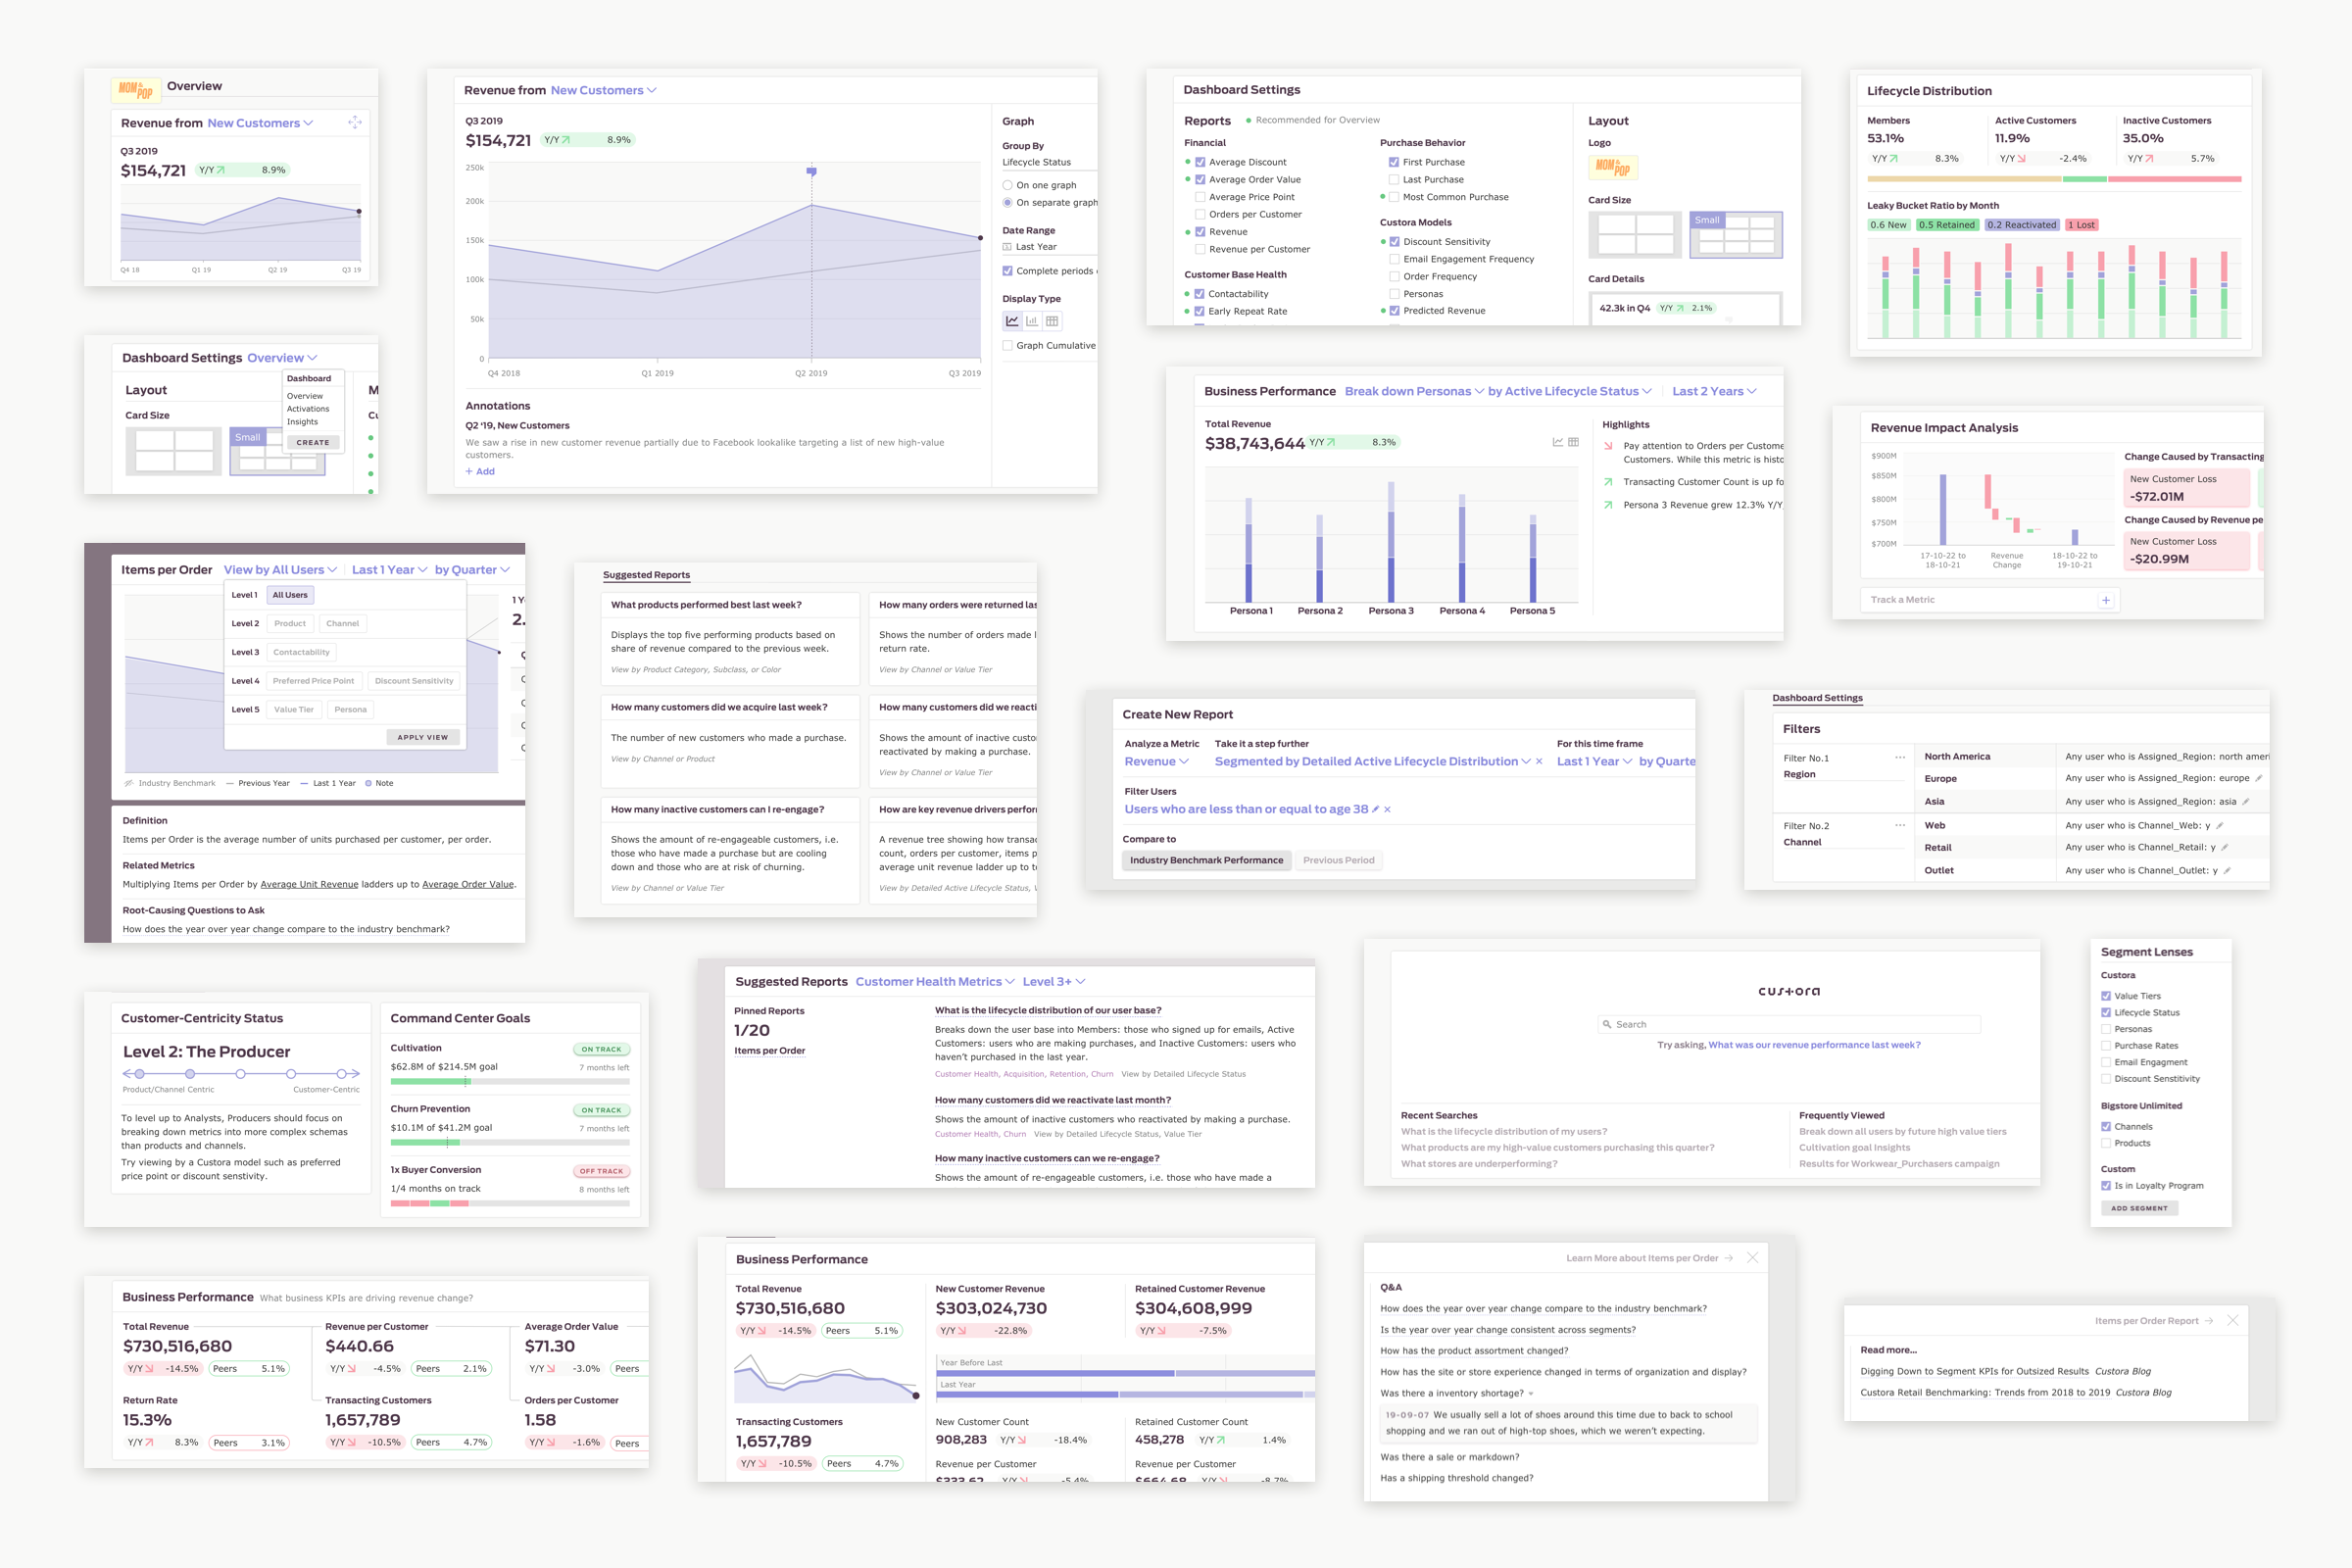
Ideas Explored
A few months later we had time to continue research and development. With workshops, sketches, and user interviews we made some big findings:
- Search: A more colloquial way to find answers to retailers’ customer questions.
-
Annotation: Provide a way to add notes to metrics, which could get as specific as marking a day a related campaign was run, or by answering root causing questions on each metric’s performance.
-
Root Causing: Breaking down revenue into sub-metrics with detailed trends.
-
App Usage: Aggregated app usage metrics such as how many campaigns were sent in the last month, how goals are performing, how key segments are trending.
-
Customer-Centricity Status: Having view variations on a graph based on whether you wanted a more revenue-based view or customer-centric view.
-
Recommended Dashboard: Allow flexibility for those who want it, but in a limited capacity, such as by having only suggested metrics to choose from. Users who want ‘the Custora view’ can choose to reset to our recommended dashboard.
- High Customization: Allow extreme customization to the level of choosing all metrics, choosing the graph type, naming the x and y axis, date ranges, etc.
A few months later we had time to continue research and development. With workshops, sketches, and user interviews we made some big findings:
- Historical First: For an overview, historical metrics are more meaningful than predictive.
- Flexible: Our users wanted to be able to filter the data by very specific date ranges and break it down to the day level.
- Comparisons: Peer benchmarks are incredibly useful in assessing trends, as are comparisons to previous performance.
- Linkage: The info on the overview should help the user dig deeper into each metric, acting as a springboard to connect with the rest of the app.
- Distribution: The overview should be shareable in multiple formats: by sending a link to non-users, in a downloadable pdf, or as spreadsheets.


Thanks for viewing, see more of my design work here. Password: CLV2011